
Discovery of Novel HIV Protease Inhibitors Using Modern Computational Techniques

1
Center for Biomedical Research, Population Council, New York, NY 10065, USA
2
Department of Pharmaceutical and Medicinal Chemistry, University of Nigeria, Nsukka 41001, Nigeria
*
Author to whom correspondence should be addressed.
Int. J. Mol. Sci. 2022, 23(20), 12149; https://doi.org/10.3390/ijms232012149
Submission received: 24 August 2022
/
Revised: 13 September 2022
/
Accepted: 1 October 2022
/
Published: 12 October 2022
(This article belongs to the Section Molecular Informatics)
Abstract
:The human immunodeficiency virus type 1 (HIV-1) has continued to be a global concern. With the new HIV incidence, the emergence of multi-drug resistance and the untoward side effects of currently used anti-HIV drugs, there is an urgent need to discover more efficient anti-HIV drugs. Modern computational tools have played vital roles in facilitating the drug discovery process. This research focuses on a pharmacophore-based similarity search to screen 111,566,735 unique compounds in the PubChem database to discover novel HIV-1 protease inhibitors (PIs). We used an in silico approach involving a 3D-similarity search, physicochemical and ADMET evaluations, HIV protease-inhibitor prediction (IC50/percent inhibition), rigid receptor–molecular docking studies, binding free energy calculations and molecular dynamics (MD) simulations. The 10 FDA-approved HIV PIs (saquinavir, lopinavir, ritonavir, amprenavir, fosamprenavir, atazanavir, nelfinavir, darunavir, tipranavir and indinavir) were used as reference. The in silico analysis revealed that fourteen out of the twenty-eight selected optimized hit molecules were within the acceptable range of all the parameters investigated. The hit molecules demonstrated significant binding affinity to the HIV protease (PR) when compared to the reference drugs. The important amino acid residues involved in hydrogen bonding and п-п stacked interactions include ASP25, GLY27, ASP29, ASP30 and ILE50. These interactions help to stabilize the optimized hit molecules in the active binding site of the HIV-1 PR (PDB ID: 2Q5K). HPS/002 and HPS/004 have been found to be most promising in terms of IC50/percent inhibition (90.15%) of HIV-1 PR, in addition to their drug metabolism and safety profile. These hit candidates should be investigated further as possible HIV-1 PIs with improved efficacy and low toxicity through in vitro experiments and clinical trial investigations.
1. Introduction
HIV protease (PR) is one of the three enzymes essential in the life cycle of the human immunodeficiency virus (HIV) survival and replication. At some point in the life cycle of HIV, immature viral particles are produced. These budded immature viral particles that contain catalytically inactive protease cannot undergo maturation to an infective form [1]. The role of PR is basically to catalyze the hydrolysis of Gag and Gag-Pol polyproteins thereby generating mature infectious virions [2]. HIV protease inhibitors work by antagonizing the process that leads to the generation of mature infectious virions. When there is a chemical inhibition of this enzyme or there is a mutation in the catalytic residues of the PR, there is a production of immature noninfectious viral particles which lacks the capacity for viral infectivity [1,3,4,5]. Therefore, HIV PR has played a key role as an attractive target for the design of drugs against acquired immunodeficiency syndrome (AIDS) [6]. HIV protease inhibitors are a class of anti-HIV drugs that inhibit the hydrolysis of Gag and Gag-Pol polyproteins, which ultimately prevents the production of mature infectious virions [7]. Currently, the FDA has approved ten protease inhibitors for clinical use. They are saquinavir, indinavir, ritonavir, nelfinavir, amprenavir, fosamprenavir, lopinavir, atazanavir, tipranavir and darunavir.
Over the decades, computer-aided drug design (CADD) has brought tremendous breakthroughs in the field of drug discovery [8,9]. Basically, CADD is used to catalyze and rationalize the drug design process while reducing costs and time [10,11]. DiMasi et al. [12] and Song et al. [13] have reported that an average of 10–15 years and an average of USD 800 million will be required to bring a new drug into the market. Paul and co-workers, in 2010, approximated the cost of drug discovery to USD 1.8 billion [14]. CADD explores computational techniques to study the drug–receptor interactions and to determine the binding potential and affinity of a given molecule to a drug target [15]. Different chemical interactions such as hydrophobic, electrostatic and hydrogen bonding are seen in the binding of ligands to the receptor. It has been applied in the earliest stage in drug discovery to identify hit compounds by high throughput screening (HTS) [11]. Virtual screening focuses on filtering libraries of compounds using in silico methods to prioritize those compounds that are most likely going to be active against a selected target. Subsequently, these hits and lead molecules are tested with a suitable activity assay for potency and ADMET properties. Notable among the modern techniques in CADD is pharmacophore modeling.
Pharmacophore is a molecular framework that carries the essential features (phoros) responsible for a drug’s biological activity (pharmacon) [16]. Similarly, the International Union of Pure and Applied Chemistry (IUPAC) has defined pharmacophore as “the ensemble of steric and electronic features that is necessary to ensure the optimal supra-molecular interactions with a specific biological target structure and to trigger (or to block) its biological response” [17,18]. There are so many applications of pharmacophore modeling in the drug discovery process ranging from virtual screening to target identification, scaffold hopping, ligand profiling, lead optimization and de novo drug design. Therefore, this method is a widely used tool in CADD and chemoinformatics fields [19].
Pharmacophoric modeling is based on the theory that two or more compounds that have common chemical functionalities, and maintain a similar spatial arrangement, will lead to similar biological activity on the same target [20]. The key important pharmacophoric feature types are hydrogen bond donors (HBDs); hydrogen bond acceptors (HBAs); hydrophobic areas (H); positively and negatively ionizable groups (PI/NI); aromatic groups (AR); and metal coordinating areas (Figure 1). Additional size restrictions in the form of shape or exclusion volumes (XVOL)—forbidden areas—can be added to represent the size and shape of the binding pocket [21]. Pharmacophore modeling can be structure-based or ligand-based. In this study, we have used ligand-based pharmacophore modeling to screen the PubChem database for compounds with bioactivity against HIV-1 protease.
2. Results and Discussion
2.1. Pharmacophore Annotation and Similarity Search
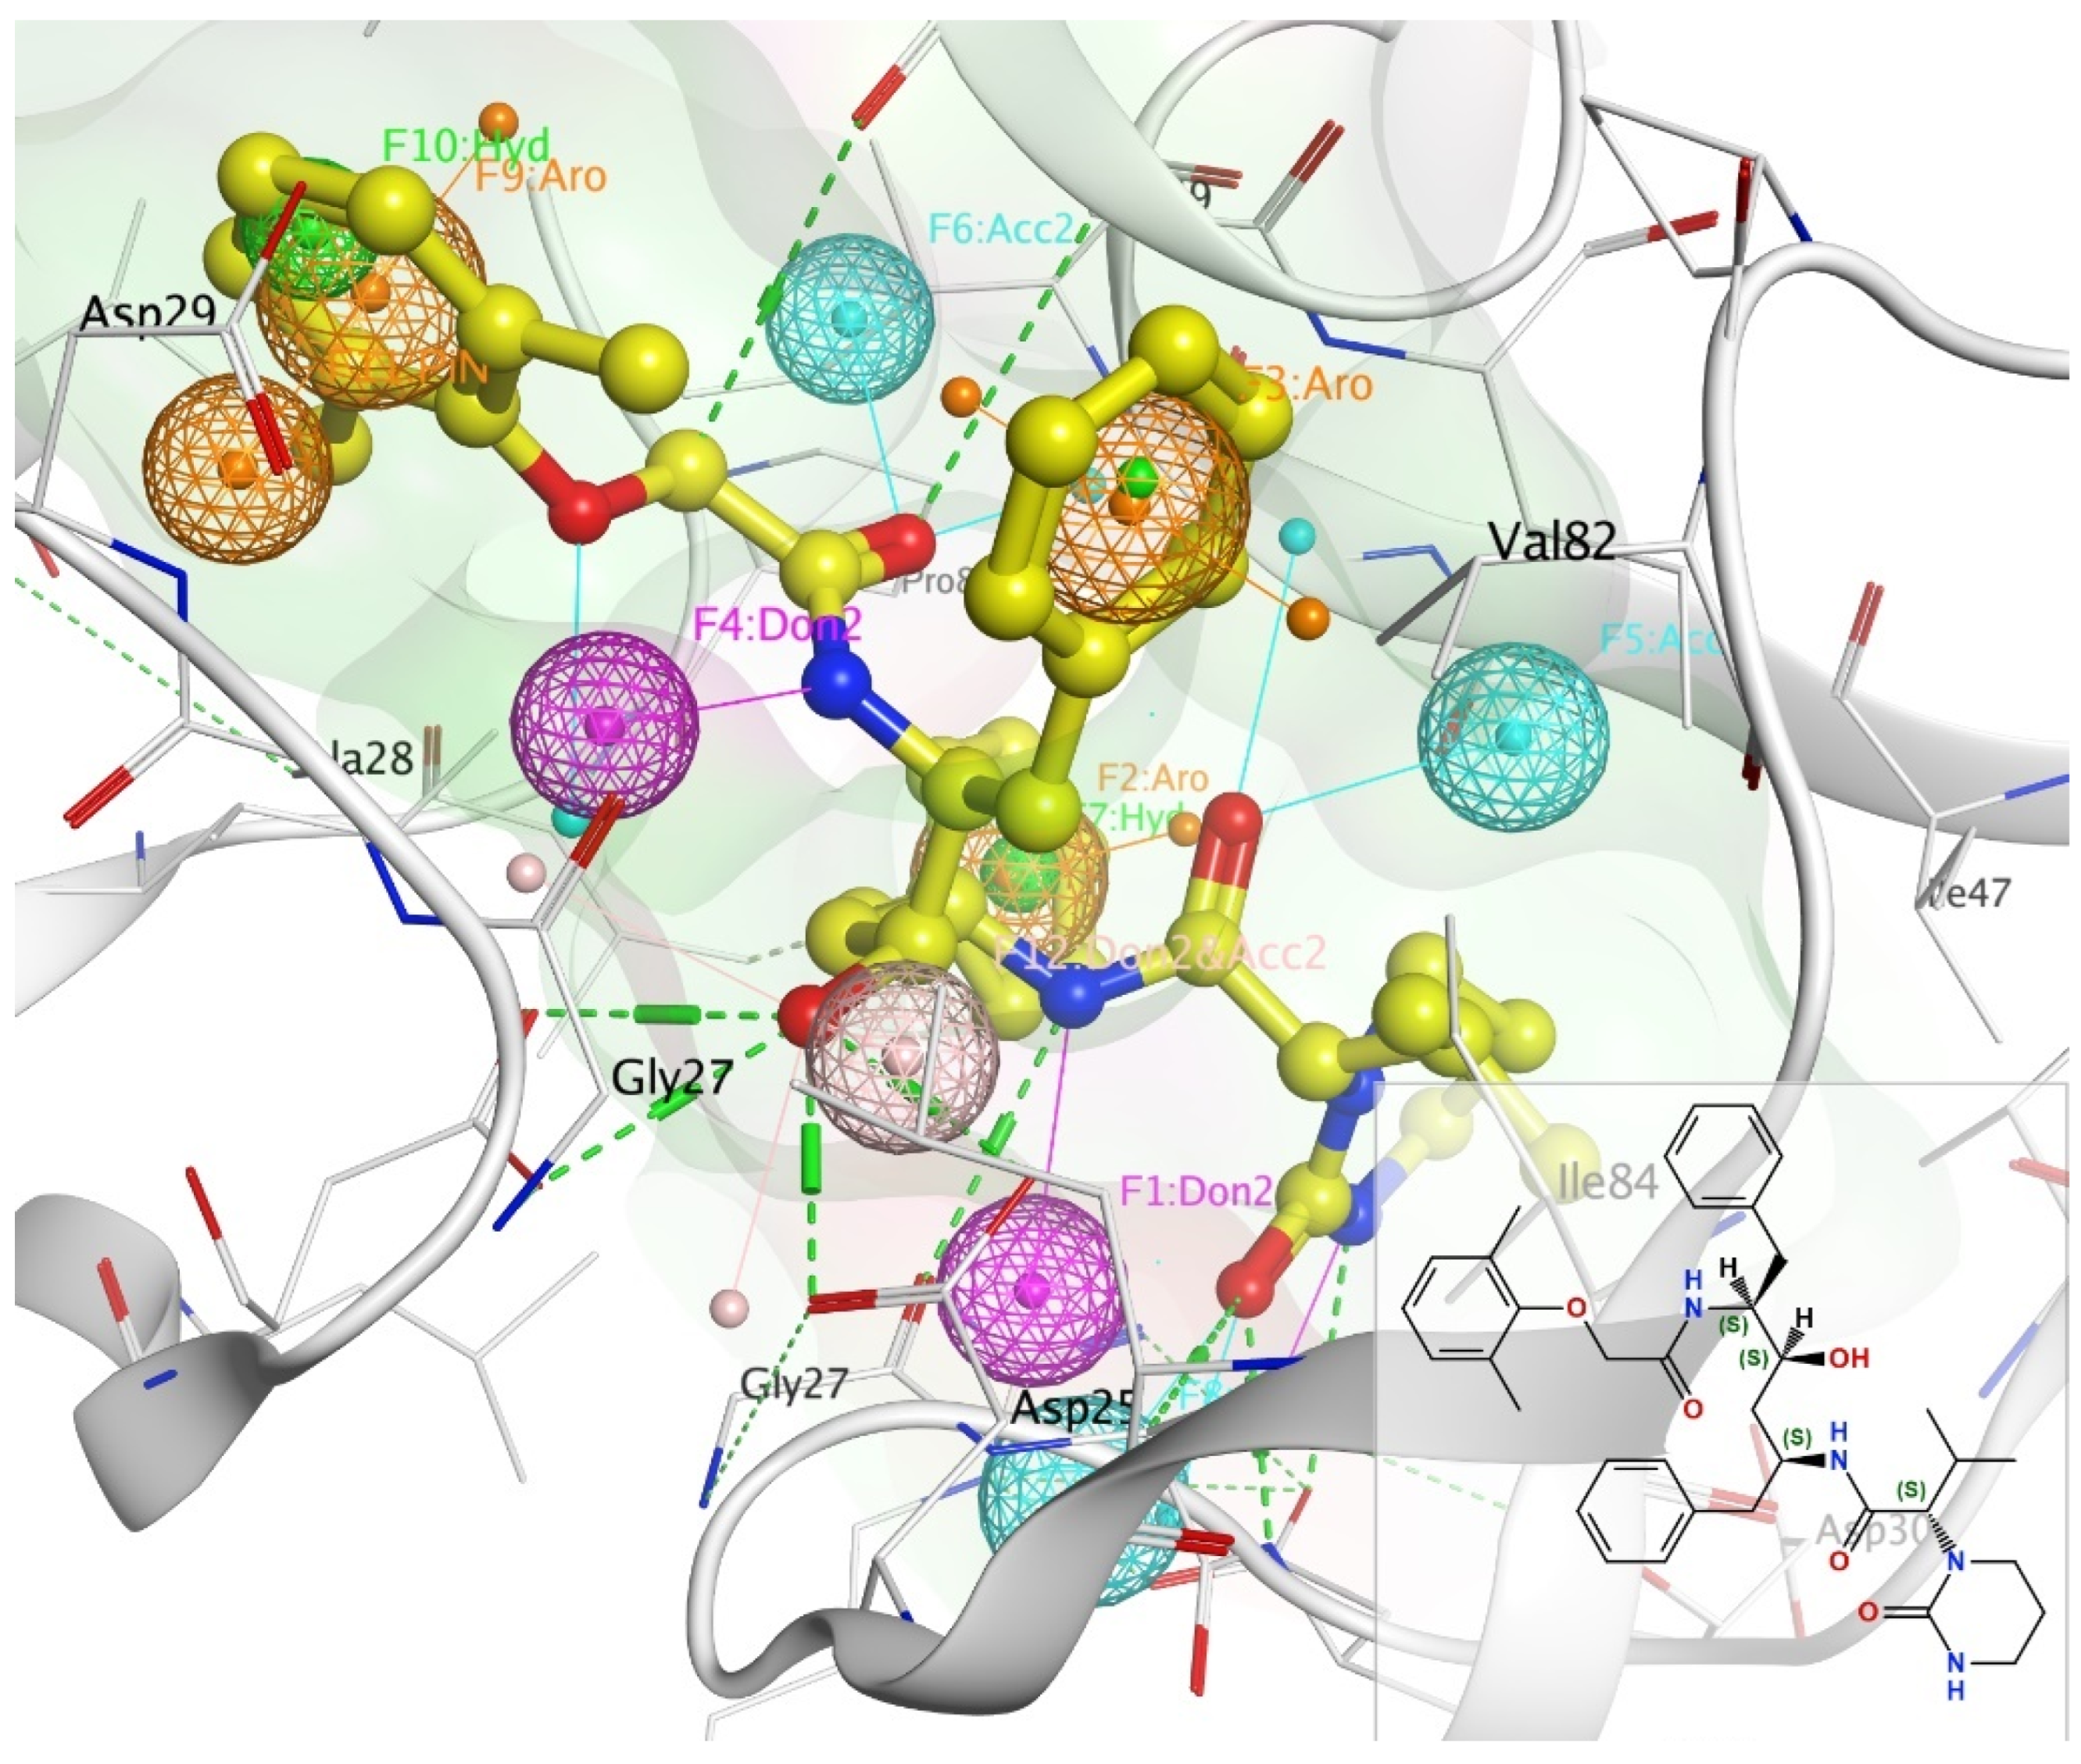
The basic annotation features of lopinavir bound to HIV-1 protease were created as shown in Figure 1: Atom (H-bond donor—Don, H-bond acceptor—Acc, hydrophobic atom—HydA); Projected (projected donor—Don2, projected acceptor—Acc2, ring normal—PiN), and Centroid (aromatic—Aro, pi-ring—PiR, hydrophobic—Hyd). Pharmacophore annotations for other reference drugs are shown in Figure S2.
The result of the pharmacophoric similarity search is summarized in Figure 2. Preliminary filtration was performed, where compounds that had more than one Lipinski violation were filtered off. The search result returned a total of 6759 similar compounds from different HIV protease inhibitors used as reference (Figure 2). At the end of further screening and optimization of these compounds, we obtained 46 hits (Figure 2). We noted that there were no hits from saquinavir, tipranavir and indinavir based on our screening criteria. The screening criteria used to exclude molecules include violation of more than 2 Lipinski’s parameters, binding affinity less than the reference drug (from the docking scores), low anti-HIV protease inhibition activity, poor ADME properties and potential toxicity. The molecules from saquinavir, tipranavir and indinavir failed in one or more of the above criteria.
2.2. Physicochemical Properties Evaluation
Table 1 shows the physicochemical properties of the compounds which are important factors in the determination of the solubility, permeability, and bioavailability of an orally delivered drug. With the exceptions of HPS/013, HPS/014, HPS/015, HPS/016, and HPS/017, we noted that the molecular weights of most of the compounds are greater than 500 Da. This is not so surprising as the molecular weights of all the reference drugs used were more than 500 Da. However, other parameters for drug-likeness according to Lipinski’s rule of five (Ro5) were obeyed, ensuring that the compounds did not violate more than one of Lipinski’s rules. Traditionally, therapeutics have been small molecules that fall within Lipinski’s rule of five (i.e., a molecule with a molecular mass less than 500 Da, no more than 5 hydrogen bond donors, no more than 10 hydrogen bond acceptors, and an octanol–water partition coefficient log P not greater than 5) [22]. Violation of not more than one rule is a good indication of molecules that will have good oral bioavailability. It should be noted that compounds that are substrates for biological transporters do not obey this rule, they can have violations up to 4 [23].
The partition coefficient (logP) is the measure of the lipophilicity of a drug and an indication of its ability to cross the cell membrane. It has served as one of the fundamental principles for drug discovery and design [24]. Maintaining a balance in octanol–water partition coefficient of a molecule is very important. All the hit molecules are within the range of Lipinski’s Ro5. When there is high lipophilicity, there will be a high rapid metabolic turnover of the [25], low solubility and poor absorption of the compound. Furthermore, an increase in lipophilicity increases the probability of binding to hydrophobic protein targets that are not the desired ones, leading to an increase in the potential for toxicity. Log P and other physicochemical properties are of potential importance in the prediction and optimization of drug-likeness of molecules.
Topological polar surface area (TPSA) is a molecular descriptor widely used in the study of drug transport properties such as intestinal absorption [26] and blood–brain barrier (BBB) penetration [27]. In addition, the polar surface area (PSA), which reflects the ligand hydrophilicity, is very vital in protein–ligand interaction [28]. The major application of TPSA in medicinal chemistry has been to evaluate how molecules can cross different membrane barriers [29]. Kelder and colleagues showed drug intestinal permeation predominated by passive diffusion and paracellular route for drugs with TPSA of less than 120 Å [30]. Compounds with a TPSA >140 Å have been identified as poorly absorbed. Most of our hit molecules have TPSA < 140 Å. The percentage solubility calculated from % ABS = 109–0.345 × TPSA [31], ranges from 60.56–72.75%. Both the TPSA and the % ABS showed that most of our hit molecules had good solubility and are well absorbed, a designation of good bioavailability upon oral administration.
2.3. Molecular Docking Studies
Molecular docking accurately predicts the experimental interaction mode and ligands affinity within the active binding site of the drug target, making it very significant in the discovery of new drugs [32]. Using the SiteFinder in MOE, the following amino acid residues were found to be part of the active binding site of the 2Q5K: ASP25, GLY27, ALA28, ASP29, ASP30, VAL32, ILE47, GLY48, GLY49, ILE50, GLY52, PHE53, ILE54, THR80, PRO81, VAL82 and ILE84. The docking protocol was further validated by docking the retrieved co-crystallized ligand (lopinavir) into the binding cavity of the 2Q5K-liponivir complex (Figure 3) and measuring the root mean square deviation (RMSD). The RMSD gave 0.9 Å. Usually, RMSD ≤ 2 Å for a pose is considered a docking success. Our docking protocol was, therefore, fully validated. Figure 3 shows the docked ligand (cyan) almost perfectly overlapped the co-crystallized ligand (yellow). Figure S1 of the supplementary material also gives more insight into the validation, where both the docked and the co-crystallized lopinavir shared the same amino acid residues of the catalytic triads (ASP 25, GLY 27 and ASP 29) as shown in Figure 4. Table 2 shows the binding free energy, ΔG (kcal/mol) from the molecular docking calculations using MOE. The ΔG of the hit molecules is lower than the reference drug used. The low ΔG (high negative values) is an indication of the high binding affinity of these molecules with HIV protease. All the hit molecules have higher binding affinity than their respective reference drugs. These docking scores suggest that the hit molecules might have better HIV-1 protease inhibitory activities. HPS/005 and HPS/006 showed the most favorable docking scores of −8.98 and −8.63 kcal/mol, respectively. Due to toxicity concerns of HPS/005 in Table 3 and Table 4, it was not further studied. Hit molecules HPS/002, HPS/004, HPS/006, HPS/007, HPS/008 and HPS/009 were selected for further studies in order to gain more insight into the nature of the chemical interactions and conformations of docked compounds. The criteria for their selection include high binding affinity when compared to the reference, significant anti-HIV activity (low IC50 and high % inhibition), good ADME properties and low toxicity potential. The docking poses were visualized, and the detailed interactions were recorded as shown in Figure 5 and Table 3, respectively.
Molecular docking simulation clearly demonstrated significant chemical interactions of the atoms of the ligands and the amino acid residues of the HIV protease (Table 3). The amino acid residues of the HIV-1 protease that interacted with the atoms of the optimized hit compounds (Table 3) are all part of the amino acid residues in the active binding sites. This further elucidates the validity of the docking protocols. All the hit molecules formed prominent hydrogen bonds with at least two catalytic residues (ASP 25, GLY 27 and ASP 29) on the floor of the active site. The carbonyl and the hydroxy group of HPS/002, through hydrogen bond interactions, combined with the O GLY 27 and N ASP 29, respectively. Other important chemical interactions include the pi-H bonding of the two 6-membered aromatic rings with the CG1 of ILE 50 and the CA of GLY 27, respectively. HPS/004 has similar interactions to those exhibited by HPS/002. HSP/002 and HPS/004 have more effective binding interactions with the HIV-1 PR than lopinavir. In addition to using the amino acid residues of the catalytic triad, they also interact effectively with other amino acid residues. These interactions help to stabilize them more in the active binding site of the receptor. The two 5-membered thiazole rings in HPS/007 interacted with NH1 ARG 8, CA GY 49 and CB PRO 81 through pi-H bonding. Furthermore, the S-2 and O-7 atoms of the HPS/007 inhibitor form a hydrogen bond with the CG1 of ILE 50 and CA of GLY 49, respectively. The sulfur atom (S-1) in the thiazole ring of HPS/006 formed two strong H-bonds with the OG1 THR 80 and CD1 ILE 54 through H-donor and H-acceptor interactions, respectively. Furthermore, the N-10 atom of the HPS/006 compound interacted with the O GLY 27, forming a strong H-bond. Other amino acid residues that played a vital role in the chemical interactions of HPS/006 and the HIV protease are ASP 25, by interacting with C-29, and GLY 49, by interacting with O-4. Likewise, the S-2 in the thiazole ring of HPS/008 interacted with the carboxyl group of the protease active site residues, ASP 29 and ASP 30 through hydrogen bonding. There were prominent hydrogen bond interactions between the 6-membered rings of HPS/008 and the CD1 of ILE 47, and amino nitrogen of ILE 50 through pi-H bonding. Other amino acid residues that played vital roles in the interactions are: GLY 27, GLY 48 and LYS 45. It was observed that HPS/007 has the highest binding affinity (−8.57 kcal/mol). In addition to the chemical interactions with the residues in the catalytic active site, the two thiazole rings contributed significantly to this high binding affinity of HPS/007 with the HIV protease. Again, the 6-membered aromatic rings, which are common in all the hit molecules played a key role in the chemical interactions, which resulted in an improved binding affinity of these molecules to the HIV protease. Figure 5 illustrates the CPK representation of the binding poses of (a) HPS/002 (b) HPS/004 (c) HPS/006 (d) HPS/007 (e) HPS/008 and (f) HPS/027 in the binding cavity of HIV-1 protease.
2.4. Anti-HIV Prediction Analysis
The results of HIV protease inhibitory activity—IC50 (µM) and % inhibition of the selected hits from different reference drugs using HIVprotI are shown in Table 2. The fourteen selected hit molecules showed significant activity against HIV-1 protease with IC50 range of −2.52–48.90 µM and 52.71–90.13% inhibition. Generally, each selected hit molecule has a better IC50 and/or % inhibition when compared to its reference drug. HPS/002 has a comparable % inhibition of 90.13% to its reference drug—lopinavir (90.12%). However, it showed lower and better IC50 of 48.90 µM than lopinavir (203.69 µM). A low IC50 value implies that the drug candidate is potent at a low concentration and ultimately may show lower systemic toxicity when administered to the patient.
2.5. ADMET Analysis
The pharmacokinetic and pharmacodynamic profiles are usually used to assess the safety and efficacy of a drug during the drug development process. Despite how promising a drug candidate may be, the ADMET drug properties determine the extent to which it can be useful as a drug. We have extensively evaluated the ADMET properties that can limit the use of drug candidates. Various ADMET properties of the optimized hit molecules were evaluated. The information can be used to predict various pharmacokinetic phenomena of these compounds, which ultimately guide the further development of new drug compounds [33]. A compound that does not meet certain ADME standards may result in poor bioavailability. In like manner, compounds which are very toxic cannot be useful as drug candidates as the risks will outweigh the potential benefits of such compounds.
2.5.1. Absorption and Distribution Evaluations
Water solubility is an essential aspect of a drug’s pharmacological reaction following oral delivery. Drugs with strong water solubility will have good absorption and bioavailability qualities. Drug absorption and bioavailability can boost plasma drug concentrations at the target location, allowing it to fulfill therapeutic actions [34]. The compounds showed good water solubility (Table 4). The absorption parameters shown in Table 4 indicate that the compounds could be absorbed from the intestinal tract upon oral administration. All the hit molecules have high GI absorption (poorly absorbed <30%), denoting an increase in permeability. High Caco-2 cell permeability is associated with a permeability value > 0.9 [35] The hit molecules and all the FDA-reference drugs except Lopinavir did not comply with threshold values. Table 4 also shows the distribution parameters analysis. For a given compound, a logBB > 0.3 is considered to readily cross the blood–brain barrier while molecules with logBB < −1 are poorly distributed to the brain. Similarly, compounds with a logPS > −2 are considered to penetrate the central nervous system (CNS) while those with logPS < −3 are considered unable to penetrate the CNS. From Table 4, all the hit molecules, including the reference drugs are not readily able to cross the blood–brain barrier (BBB) or penetrate the central nervous system (CNS). The only exception to this is lopinavir, which can penetrate the CNS but was not readily able to cross the BBB. The volume of distribution, VDss is the theoretical volume that the total dose of a drug would need to be uniformly distributed to give the same concentration as in blood plasma. The higher VD is the more of a drug is distributed in the tissue rather than plasma. VDss is considered low if below 0.71 L/kg (log VDss < −0.15) and high if above 2.81 L/kg (log VDSS > 0.45) [35]. While some of the hit molecules have a high volume of distribution at a steady state (VDss), others have a low to moderate VDss.
2.5.2. Metabolism and Excretion
Table 5 shows the metabolism and excretion parameters analysis. CYP1A2, CYP2C19, CYP2C9, CYP2D6, CYP2E1 and CYP3A4 play key roles in drug metabolism. The results suggest that except for lopinavir, HPS/015, HPS/019, HPS/024 and HPS/028, all the other hit molecules and reference drugs inhibit the CYP3A4 sub-enzymes of cytochrome P450 (CYP). CYP3A4 is responsible for metabolizing ∼50% of all drugs by itself [36]. All the hit molecules and the reference drugs do not inhibit CYP2D6 except HPS/017, HPS/028 and nelfinavir. Most of the compounds and drugs evaluated are not CYP2C9 inhibitors while others inhibit it. It has been demonstrated that CYP2C9 can metabolize some marketed drugs [36].
All except HPS/002 are organic cation transporter 2 (OCT2) non-substrates. OCT2 is a renal uptake transporter that plays a critical role in the disposal and renal clearance of drugs and endogenous compounds [36]. OCT2 substrates can adversely interact with co-administered OCT2 inhibitors. This evaluation has provided insightful information on drug clearance and potential contraindications of OCT2 transporter drug candidates.
2.5.3. Toxicity Analysis
The LD50 (mg/kg body weight) is the median lethal dose at which 50% of test subjects die upon exposure to a compound. The Globally Harmonized System of classification of labeling of chemicals (GHS) has categorized LD50—mg/kg into the following classes: Class I: fatal if swallowed (LD50 ≤ 5); Class II: fatal if swallowed (5 < LD50 ≤ 50); Class III: toxic if swallowed (50 < LD50 ≤ 300); Class IV: harmful if swallowed (300 < LD50 ≤ 2000); Class V: may be harmful if swallowed (2000 < LD50 ≤ 5000) and Class VI: non-toxic (LD50 > 5000). None of the hits is fatal when swallowed as shown in Table 6. Some are toxic when swallowed while others may be harmful when swallowed. This is an affirmation that drugs are poisons and not food that is non-toxic when swallowed (Class VI). This harmful nature may have to do with some side effects that may be associated with drugs when taken. In Table 6, almost all the hits are found to be inactive, with a high probability, to hepatotoxicity, carcinogenicity, immunotoxicity, cytotoxicity, aromatase, estrogen receptor-α, androgen receptor and peroxisome proliferator-activated receptor gamma. This finding gives more credence to our hit compounds as potential HIV protease inhibitors. The androgen receptor (AR) is the main biomolecular target involved in the development and progression of hormone-dependent prostate cancer [37]. In silico evaluation of small-molecule binding at the AR is very important for the screening of potential androgen-disrupting chemicals [38] causing endocrine disorders [39,40]. Additionally, disruption of the androgen system is associated with decreased sperm count, increased infertility [41] and diabetes mellitus [42]. We have predicted from this study that ritonavir, atazanavir and darunavir have hepatotoxicity potentials (Table 6).
The AMES (the bacterial reverse mutation test) toxicity profile (Table 7) indicates that the hit molecules do not have potential mutagenic tendencies. It is only PC_HPS/017 that tests positive and therefore may act as a carcinogen since HIV-1 is often linked to mutation. The maximum recommended tolerated dose (MRTD) provides an estimate of the toxic dose threshold of chemicals in humans. For a given compound, an MRTD of ≤20.477 log(mg/kg/day) is considered low, and higher >0.477 log log(mg/kg/day). All the hit molecules showed values less than the maximum human-tolerated dose (0.477 log mg/kg/day), indicating no possible dose-related toxicity. None of the hit molecules, including the reference drugs, are considered a likely inhibitor of hERGI. HPS/002, HPS/004, HPS/007, HPS/023, HPS/027 and some other hit molecules are considered possible hERGII inhibitors while HPS/015 and some other hits will potentially not inhibit hERGII. Human ether-a-go-go-related gene (HERG) potassium channels are expressed in multiple tissues including the heart and adenocarcinomas [43]. The pharmacological reduction of HERG currents may cause acquired long QT syndrome and life-threatening “torsade de pointes” arrhythmias [44]. HERG expression in tumor cells accelerates cell proliferation [45], and inhibition of HERG currents has been shown to reduce cell proliferation [46]. The hepatotoxicity result shows that the hit molecules and all the FDA-approved drugs used as reference could be related to at least one physiological or pathological event, which could be associated with disruption of normal liver function. T. pyriformis is a protozoa bacterium with its toxicity measured in log μg/L often used as a toxic endpoint. If the value is <−0.5 log μg/L for any compound, it is considered to be toxic [47]. None of the hit molecules and the reference drugs showed toxicity against T. pyriformis. Similarly, Minnow toxicity was assessed. It is an indication of the lethal concentration (LC50) that represents the concentration of a molecule required to cause the death of 50% of the flathead minnows. A compound with log LC50 < −0.3 is regarded as having high acute toxicity [36]. While some hit molecules may be associated with minnow toxicity, others are not. In the light of the foregoing discussions, we observe that the majority of the hit molecules’ predicted toxicities (Table 6 and Table 7) maintain a relatively lower acute toxicity risk compared to reference drugs.
3. Materials and Methods
3.1. Database
The database for this study is PubChem (https://pubchem.ncbi.nlm.nih.gov/; accessed on 30 March 2022). It is an open chemistry database maintained by the National Institutes for Health (NIH). It was launched in 2004 and has remained a veritable chemical information resource for scientists involved in drug discovery research. PubChem is the world’s largest freely accessible database containing approximately 111 M compounds, 281 M substances, 295 M bioactivities, 34 M pieces of literature, and 42 M patents.
3.2. Physicochemical Evaluation for Drug-Likeness
The Molecular Descriptors Algorithm in MOE was used to evaluate the physicochemical properties of the compounds. These properties include molecular weight (MW), log octanol/water partition coefficient (log P), number of H-bond donor atoms (a_don), number of H-bond acceptors (a_acc), topological polar surface area (TPSA), number of rotatable bonds (b_rotN). We applied Lipinski’s rule of five to evaluate the drug-likeness. The result is shown in Table 1.
3.3. ADMET Predictions
pkCSM was used to evaluate the pharmacokinetic (absorption, distribution, metabolism and excretion), as well as toxicity (ADMET) properties of the screened compounds [36]. pkCSM is a free online webserver for the prediction of small-molecule pharmacokinetic and toxicity properties using graph-based signatures (http://structure.bioc.cam.ac.uk/pkcsm; accessed on 30 March 2022). The pharmacokinetic properties for absorption include water solubility, Caco-2 permeability, intestinal absorption (human), skin permeability, P-glycoprotein substrate, P-glycoprotein I inhibitor and P-glycoprotein II inhibitor; distribution: VDss (human), fraction unbound (human), BBB permeability and CNS permeability; metabolism: CYP2D6 substrate, CYP3A4 substrate, CYP1A2 inhibitor, CYP2C19 inhibitor, CYP2C9 inhibitor, CYP2D6 inhibitor and CYP3A4 inhibitor; excretion: total clearance and renal OCT2 substrate; toxicity: AMES toxicity, maximum tolerated dose (human), hERG I inhibitor, hERG II inhibitor, oral rat acute toxicity (LD50), oral rat chronic toxicity (LOAEL), hepatotoxicity, skin sensitization, T. Pyriformis toxicity and minnow toxicity. The results of these evaluations are shown in Table 4, Table 5, Table 6 and Table 7.
We went further to evaluate organ toxicity (hepatotoxicity), toxicity endpoints (carcinogenicity, immunotoxicity, mutagenicity, and cytotoxicity), hormonal-related toxicity (androgen receptor, aromatase, estrogen receptor alpha, and peroxisome proliferator-activated receptor gamma (PPAR-Gamma) using ProTox II as shown in Table 3 [48]. The acute toxicity measured as LD50 was equally predicted. The ProTox II can be assessed with this link: http://tox.charite.de/protox_II (accessed on 30 March 2022).
3.4. Pharmacophore Generation and Similarity Search
Pharmacophore Query Editor in MOE was used to annotate the 2Q5K-lopinavir complex loaded in MOE as well as rendering the resulting annotations graphically in the MOE window (Figure 1). Annotation is the process of identifying regions of pharmacophoric importance in space around a molecular conformation and associating with those regions of pharmacophore types. The unified annotation scheme was used. In addition to the search mechanism in the PubChem database, this query was also used to search against the database to identify the similar pharmacophore model among them and separate the active compounds from the rest of the database.
3.5. Molecular Docking (MOE, 2020) [49]
The crystal structure of the wild type HIV-1 protease co-crystallized with lopinavir at a resolution of 1.95 Å (Figure 6) was obtained from the Protein Data Bank (PDB ID: 2Q5K) [50], and loaded into Discovery Studio. The preliminary preparation of the protein was performed in Discovery Studio where the water molecules and heteroatoms were eliminated. The 2Q5K was then loaded into the MOE. The Quickprep algorithm in MOE comprising structure preparation and protonate 3D was used to complete protein preparation. The polar hydrogens were added. A temperature of 300 K, a salt concentration of 0.1 and pH 7 was specified in the implicit solvated environment to carry out the protonation process. Then, the structure was energy-minimized in the MMFF94x force field to an RMS gradient of 0.1 kcalmol−1/Å2.
The Finder Site in MOE was used to calculate the possible active sites in a receptor from the 3D atomic coordinates of the receptor—2Q5K, which will help to determine potential sites for ligand binding docking calculations. The Site Finder methodology is based upon Alpha Shapes. The generated sites are ranked according to their Propensity for Ligand Binding (PLB) score, which is based on the amino acid composition of the pocket [51].
The dataset from the outputs of the pharmacophore-based similarity search was prepared and loaded into the MOE where they were further prepared and energy-minimized. All the hit molecules were docked as a database into the predicted binding domain, and 30 conformations were generated for each molecule in the 2Q5K binding site. The triangular matcher placement and rigid receptor refinement were employed. Among them, the conformation with the lowest docking score was chosen to study the binding orientations of the ligands, and each complex was assessed and ranked by the London ΔG energy scoring function.
3.6. Prediction of HIV Activity
In this study, we used HIVprotI to predict the anti-HIV activity of the selected hits. The half maximal inhibitory concentration. IC50 (µM) and the percentage inhibition (%values) of these compounds were evaluated in silico. HIVprotI is a web-based algorithm for the prediction and design of protein-specific anti-HIV compounds (http://bioinfo.imtech.res.in/manojk/hivproti; accessed on 30 March 2022). This web tool was developed by experimentally testing the IC50 and percentage inhibition activity of various inhibitors datasets against all three HIV proteins (reverse transcriptase RT, protease, PR, and integrase, IN). These inhibitors from the ChEMBL database were further used to develop support vector machine (SVM)-based quantitative structure–activity relationship (QSAR) models using the inhibitor features, descriptors and fingerprints [52].
4. Conclusions
Pharmacophore-guided 3D-similarity search, ADMET profiling, molecular docking studies, and in silico evaluation of anti-HIV activity were carried out on the PubChem database containing 111,566,735 compounds to evaluate potential new antiviral agents against HIV-1 protease. The in silico analysis revealed that fourteen (HPS/002, HPS/004, HPS/006. HPS/007, HPS/008, HPS/009, HPS/010, HPS/011, HPS/012, HPS/013, HPS/014, HPS/018, HPS/020 and HPS/024) out of the twenty-eight selected optimized hit molecules were within the acceptable range of all the parameters investigated, such as physicochemical and ADMET parameters, the predicted IC50/percent inhibition of HIV PR protein, docking scores and free binding energies.
There are clear indications from the docking results that residues ASP25, GLY27, ASP29, ASP30, and ILE50 are involved in essential hydrogen bonding and п-п stacked interactions stabilized the optimized hit molecules from PubChem in the active binding site of the HIV-1 PR (2Q5K), thereby playing vital roles for the observed anti-HIV activity. The MD simulation showed that the molecules are stable in the active binding site of the HIV-1 protease. Out of the fourteen hit candidates, HPS/002 and HPS/004 have been found to be most promising in terms of IC50/percent inhibition of HIV-1 PR and MD stability, in addition to their drug metabolism and safety profiles. We, therefore, propose that these fourteen hit molecules with non-toxic and good bioavailability predicted qualities, with emphasis on HPS/002 and HPS/004, should be investigated further as possible PR inhibitors through wet lab experiments (in vitro/in vivo and pre-clinical) and clinical trial investigations. This is on the premise that computational studies alone are not sufficient by themselves in the drug discovery process.
Supplementary Materials
The following supporting information can be downloaded at: https://www.mdpi.com/article/10.3390/ijms232012149/s1.
Author Contributions
Conceptualization, S.N.O., P.A. and H.A.; methodology, S.N.O.; investigation, S.N.O., P.A. and H.A.; data curation, S.N.O.; writing—original draft preparation, S.N.O.; writing—review and editing, P.A.; visualization, S.N.O. and P.A. All authors have read and agreed to the published version of the manuscript.
Funding
The research received no external funding.
Institutional Review Board Statement
Not applicable.
Informed Consent Statement
Not applicable.
Data Availability Statement
Not applicable.
Acknowledgments
The authors are grateful to Marty Jeiven for funding this work through the Jeiven fellowship at the Center for Biomedical Research, Population Council, New York, USA. We equally appreciate Jim Sailer, the Director of the Center for Biomedical Research, Population Council for providing us with the enabling environment to carry out this research. Rebecca Brodsky and Lorna Begg are fully appreciated for their support.
Conflicts of Interest
The authors declare no conflict of interest.
References
- Kohl, N.E.; Emini, E.A.; Schleif, W.A.; Davis, L.J.; Davis, J.C.; Heimbach, J.C.; Dixon, R.A.F.; Scolnick, E.M.; Sigal, I.S. Active human immunodeficiency virus protease is required for viral infectivity. Proc. Natl. Acad. Sci. USA 1988, 85, 4686. [Google Scholar] [CrossRef] [PubMed] [Green Version]
- Fun, A.; Wensing, A.M.; Verheyen, J.; Nijhuis, M. Human Immunodeficiency Virus Gag and protease: Partners in resistance. Retrovirology 2012, 9, 63. [Google Scholar] [CrossRef] [PubMed] [Green Version]
- Seelmeier, S.; Schmidt, H.; Turk, V.; von der Helm, K. Human immunodeficiency virus has an aspartic-type protease that can be inhibited by pepstatin A. Proc. Natl. Acad. Sci. USA 1988, 85, 6612–6616. [Google Scholar] [CrossRef] [Green Version]
- McQuade, T.J.; Tomasselli, A.G.; Liu, L.; Karacostas, V.; Moss, B.; Sawyer, T.K.; Heinrikson, R.L.; Tarpley, W.G. A synthetic HIV-1 protease inhibitor with antiviral activity arrests HIV-like particle maturation. Science 1990, 247, 454–456. [Google Scholar] [CrossRef] [PubMed]
- Kaplan, A.H.; Zack, J.A.; Knigge, M.F.; Paul, D.A.; Kempf, D.J.; Norbeck, D.W.; Swanstom, R. Partial inhibition of the human immunodeficiency virus type 1 protease results in aberrant virus assembly and the formation of noninfectious particles. J. Virol. 1993, 67, 4050–4055. [Google Scholar] [CrossRef] [PubMed] [Green Version]
- Weber, I.T.; Wang, Y.-F. HIV protease: Role in viral replication, protein-ligand X-ray crystal structures and inhibitor design. In Aspartic Proteases as Therapeutic Targets. Methods and Principles in Medicinal Chemistry; Ghosh, A.K., Ed.; Wiley-VCH Verlag GmbH & Co. KGaA: Weinheim, Germany, 2010; Volume 45, pp. 109–137. [Google Scholar]
- Clavel, F.; Mammano, F. Role of Gag in HIV Resistance to Protease Inhibitors. Viruses 2010, 2, 1411–1426. [Google Scholar] [CrossRef]
- Sliwoski, G.; Kothiwale, S.; Meiler, J.; Lowe, E.W.E. Computational Methods in Drug Discovery. Pharmacol. Rev. 2014, 66, 334–395. [Google Scholar] [CrossRef] [Green Version]
- De Ruyck, J.; Brysbaert, G.; Blossey, R.; Lensink, M. Molecular docking as a popular tool in drug design, an in silico travel. Adv. Appl. Bioinform. Chem. 2016, 9, 1–11. [Google Scholar] [CrossRef] [Green Version]
- Taft, C.A.; Da Silva, V.B.; Da Silva, C.H. Current topics in computer-aided drug design. J Pharm Sci. 2008, 97, 1089–1098. [Google Scholar] [CrossRef]
- Macalino, S.J.Y.; Gosu, V.; Hong, S.; Choi, S. Role of computer-aided drug design in modern drug discovery. Arch. Pharmacal. Res. 2015, 38, 1686–1701. [Google Scholar] [CrossRef]
- Dimasi, J.A.; Hansen, R.W.; Grabowski, H.G. The price of innovation: New estimates of drug development costs. J. Health Econ. 2003, 22, 151–185. [Google Scholar] [CrossRef] [Green Version]
- Song, C.M.; Lim, S.J.; Tong, J.C. Recent advances in computer-aided drug design. Brief Bioinform. 2009, 10, 579–591. [Google Scholar] [CrossRef] [PubMed] [Green Version]
- Paul, S.M.; Mytelka, D.S.; Dunwiddie, C.T.; Persinger, C.C.; Munos, B.H.; Lindborg, S.R.; Schacht, A.L. How to improve R&D productivity: The pharmaceutical industry’s grand challenge. Nat. Rev. Drug Discov. 2010, 9, 203–214. [Google Scholar]
- Baig, M.H.; Ahmad, K.; Roy, S.; Ashraf, J.M.; Adil, M.; Siddiqui, M.H.; Khan, S.; Kamal, M.A.; Provazník, I.; Choi, I. Computer Aided Drug Design: Success and Limitations. Curr. Pharm. Des. 2016, 22, 572–581. [Google Scholar] [CrossRef] [PubMed]
- Ehrlich, P. Ueber den jetzigen Stand der Chemotherapie. Ber. Dtsch. Chem. Ges. 1909, 42, 17–47. [Google Scholar] [CrossRef] [Green Version]
- Wermuth, C.G.; Ganellin, C.R.; Lindberg, P.; Mitscher, L.A. Glossary of terms used in medicinal chemistry. Pure Appl. Chem. 1998, 70, 1129–1142. [Google Scholar] [CrossRef]
- Kaserer, T.; Beck, K.R.; Akram, M.; Odermatt, A.; Schuster, D.; Willett, P. Pharmacophore Models and Pharmacophore-Based Virtual Screening: Concepts and Applications Exemplified on Hydroxysteroid Dehydrogenases. Molecules 2015, 20, 22799–22832. [Google Scholar] [CrossRef] [Green Version]
- Voet, A.; Banwell, E.F.; Sahu, K.K.; Heddle, J.G.; Zhang, K.Y.J. Protein Interface Pharmacophore Mapping Tools for Small Molecule Protein: Protein Interaction Inhibitor Discovery. Curr. Top. Med. Chem. 2013, 3, 989–1001. [Google Scholar] [CrossRef]
- Giordano, D.; Biancaniello, C.; Argenio, M.A.; Facchiano, A. Drug Design by Pharmacophore and Virtual Screening Approach. Pharmaceuticals 2022, 15, 646. [Google Scholar] [CrossRef]
- Vuorinen, A.; Schuster, D. Methods for generating and applying pharmacophore models as virtual screening filters and for bioactivity profiling. Methods 2015, 71, 113–134. [Google Scholar] [CrossRef]
- Goodwin, R.J.; Bunch, J.; McGinnity, D.F. Mass Spectrometry Imaging in Oncology Drug Discovery. Adv. Cancer Res. 2017, 134, 133–171. [Google Scholar] [CrossRef]
- Ugwu, D.I.; Okoro, U.C.; Ukoha, P.O.; Gupta, A.; Okafor, S.N. Novel anti-inflammatory and analgesic agents: Synthesis, molecular docking and in vivo studies. J. Enzym. Inhib. Med. Chem. 2018, 33, 405–415. [Google Scholar] [CrossRef] [Green Version]
- Gupta, S.P. QSAR studies on drugs acting at the central nervous system. Chem. Rev. 1989, 89, 1765–1800. [Google Scholar] [CrossRef]
- Van de Waterbeemd, H.; Smith, D.A.; Beaumont, K.; Walker, D.K. Property-based design: Optimization of drug absorption and pharmacokinetics. J. Med. Chem. 2001, 44, 1313–1333. [Google Scholar] [CrossRef]
- Li, S.F.; He, H.D.; Parthiban, L.J.; Yin, H.Q. Serajuddin ATM IV-IVC considerations in the development of immediate-release oral dosage form. J. Pharm. Sci. 2005, 94, 1396–1417. [Google Scholar] [CrossRef]
- Strazielle, N.; Ghersi-Egea, J.F. Factors affecting delivery of antiviral drugs to the brain. Rev. Med. Virol. 2005, 15, 105–133. [Google Scholar] [CrossRef]
- Ezeokonkwo, M.A.; Ogbonna, O.N.; Okafor, S.N.; Godwin-Nwakwasi, E.U.; Ibeanu, F.N.; Okoro, U.C. Angular Phenozaxine Ethers as Potent Multi-microbial Targets Inhibitors: Design, Synthesis, and Molecular Docking Studies. Front. Chem. 2017, 5, 107. [Google Scholar] [CrossRef] [Green Version]
- Ertl, P.; Rohde, B.; Selzer, P. Fast calculation of molecular polar surface area as a sum of fragment-based contributions and its application to the prediction of drug transport properties. J. Med. Chem. 2000, 43, 3714–3717. [Google Scholar] [CrossRef]
- Kelder, J.; Grootenhuis, P.D.; Bayada, D.M.; Delbressine, L.P.; Ploemen, J.P. Polar molecular surface as a dominating determinant for oral absorption and brain penetration of drugs. Pharm. Res. 1999, 16, 1514–1519. [Google Scholar] [CrossRef]
- Zhao, Y.H.; Abraham, M.H.; Le, J.; Hersey, A.; Luscombe, C.N.; Beck, G.; Sherborne, B.; Cooper, I. Rate-limited steps of human oral absorption and QSAR studies. Pharm. Res. 2002, 19, 1446–1457. [Google Scholar] [CrossRef]
- Crisan, L.; Pacureanu, L.; Bora, A.; Avram, S.; Kurunczi, L.; Simon, Z. QSAR study and molecular docking on indirubin inhibitors of Glycogen Synthase Kinase-3. Cent. Eur. J. Chem. 2013, 11, 63–77. [Google Scholar] [CrossRef]
- Tibbitts, J.; Canter, D.; Graff, R.; Smith, A.; Khawli, L.A. Key factors influencing ADME properties of therapeutic proteins: A need for ADME characterization in drug discovery and development. MAbs 2016, 8, 229–245. [Google Scholar] [CrossRef] [PubMed] [Green Version]
- Tripathy, D.; Nayak, B.S.; Mohanty, B.; Mishra, B. Solid dispersion: A technology for improving aqueous solubility of drug. J. Pharm. Adv. Res. 2019, 2, 577–586. [Google Scholar]
- Pires, D.E.V.; Blundell, T.L.; Ascher, D.B. pkCSM: Predicting small-molecule pharmacokinetic and toxicity properties using graph-based signatures. J. Med. Chem. 2015, 58, 4066–4072. [Google Scholar] [CrossRef]
- Daly, A.K.; Rettie, A.E.; Fowler, D.M.; Miners, J.O. Pharmacogenomics of CYP2C9: Functional and clinical considerations. J. Pers. Med. 2017, 8, 1. [Google Scholar] [CrossRef] [Green Version]
- Heinlein, C.A.; Chang, C.S. Androgen Receptor in Prostate Cancer. Endocr. Rev. 2004, 25, 276–308. [Google Scholar] [CrossRef] [Green Version]
- Vedani, A.; Dobler, M.; Hu, Z.; Smieško, M. OpenVirtualToxLab—A Platform for Generating and Exchanging in Silico Toxicity Data. Toxicol. Lett. 2015, 232, 519–532. [Google Scholar] [CrossRef] [PubMed] [Green Version]
- Takeuchi, T.; Tsutsumi, O.; Ikezuki, Y.; Takai, Y.; Taketani, Y. Positive Relationship between Androgen and the Endocrine Disruptor, Bisphenol A, in Normal Women and Women with Ovarian Dysfunction. Endocr. J. 2004, 51, 165–169. [Google Scholar] [CrossRef] [Green Version]
- Mnif, W.; Hassine, A.I.H.; Bouaziz, A.; Bartegi, A.; Thomas, O.; Roig, B. Effect of Endocrine Disruptor Pesticides: A Review. Int. J. Environ. Res. Public. Health 2011, 8, 2265–2303. [Google Scholar] [CrossRef] [Green Version]
- Luccio-Camelo, D.C.; Prins, G.S. Disruption of Androgen Receptor Signaling in Males by Environmental Chemicals. J. Steroid Biochem. Mol. Biol. 2011, 127, 74–82. [Google Scholar] [CrossRef] [Green Version]
- Sakkiah, S.; Wang, T.; Zou, W.; Wang, Y.; Pan, B.; Tong, W.; Hong, H. Endocrine Disrupting Chemicals Mediated through Binding Androgen Receptor Are Associated with Diabetes Mellitus. Int. J. Environ. Res. Public. Health 2018, 15, 25. [Google Scholar] [CrossRef] [PubMed] [Green Version]
- Crociani, O.; Guasti, L.; Balzi, M.; Becchetti, A.; Wanke, E.; Olivotto, M.; Wymore, R.S. Arcangeli A Cell-cycle-dependent expression of HERG1 and HERG1B isoforms in tumor cells. J. Biol. Chem. 2003, 278, 2947–2955. [Google Scholar] [CrossRef]
- Thomas, D.; Wu, K.; Kathöfer, S.; Katus, H.A.; Schoels, W.; Kiehn, J.; Karle, C.A. The antipsychotic drug chlorpromazine inhibits HERG potassium channels. Br. J. Pharmacol. 2003, 139, 567–574. [Google Scholar] [CrossRef] [Green Version]
- Wang, H.; Zhang, Y.; Cao, L.; Han, H.; Wang, J.; Yang, B.; Nattell, S.; Wang, Z. HERG K+ channel, a regulator of tumor cell apoptosis and proliferation. Cancer Res. 2002, 62, 4843–4848. [Google Scholar]
- Smith, G.A.M.; Tsui, H.W.; Newell, E.W.; Jiang, X.; Zhu, X.P.; Tsui, F.W.L.; Schlichter, L.C. Functional up-regulation of HERG K+ channels in neoplastic hematopoietic cells. J. Biol. Chem. 2002, 277, 18528–18534. [Google Scholar] [CrossRef] [Green Version]
- Crisan, L.; Bora, A. Small Molecules of Natural Origin as Potential Anti-HIV Agents: A Computational Approach. Life 2021, 11, 722. [Google Scholar] [CrossRef]
- Banerjee, P.; Eckert, A.O.; Schrey, A.K.; Preissner, R. ProTox-II: A webserver for the prediction of toxicity of chemicals. Nucleic. Acids. Res. 2018, 46, W257–W263. [Google Scholar] [CrossRef] [Green Version]
- Chemical Computing Group ULC. Molecular Operating Environment (MOE); 2020.09. 1010 Sherbrooke St. West, Suite #910, H3A 2R7; Chemical Computing Group ULC: Montreal, QC, Canada, 2020. [Google Scholar]
- Reddy, G.S.; Ali, A.; Nalam, M.N.; Anjum, S.G.; Cao, H.; Nathans, R.S.; Schiffer, C.A.; Rana, T.M. Design and synthesis of HIV-1 protease inhibitors incorporating oxazolidinones as P2/P2′ ligands in pseudosymmetric dipeptide isosteres. J. Med. Chem. 2007, 50, 4316–4328. [Google Scholar] [CrossRef] [Green Version]
- Soga, S.; Shirai, H.; Kobori, M.; Hirayama, N. Use of Amino Acid Composition to Predict Ligand-Binding Sites. J. Chem. Inf. Model. 2007, 47, 400–406. [Google Scholar] [CrossRef]
- Qureshi, A.; Rajput, A.; Kaur, G.; Kumar, M. HIVprotI: An integrated web-based platform for prediction and design of HIV proteins inhibitors. J. Cheminform. 2018, 10, 12. [Google Scholar] [CrossRef]
Figure 1.
Pharmacophore annotation of lopinavir bound to 2Q5K using unified scheme. Key: H-bond donor—Don (pink), H-bond acceptor—Acc (cyan), hydrophobic atom—HydA (green), projected donor—Don2 (pink), projected acceptor—Acc2 (cyan), aromatic—Aro (orange).
Figure 1.
Pharmacophore annotation of lopinavir bound to 2Q5K using unified scheme. Key: H-bond donor—Don (pink), H-bond acceptor—Acc (cyan), hydrophobic atom—HydA (green), projected donor—Don2 (pink), projected acceptor—Acc2 (cyan), aromatic—Aro (orange).

Figure 2.
Similarity search outcome using different HIV I protease inhibitors as reference drugs.

Figure 3.
Validation of the docking protocol with HIV-1 protease bound to lopinavir. The docked lopinavir (green) was overlaid on the co-crystallized lopinavir (yellow).
Figure 3.
Validation of the docking protocol with HIV-1 protease bound to lopinavir. The docked lopinavir (green) was overlaid on the co-crystallized lopinavir (yellow).

Figure 4.
(a) The 3D and (b) 2D representation of lopinavir binding to the catalytic triad of 2Q5K.

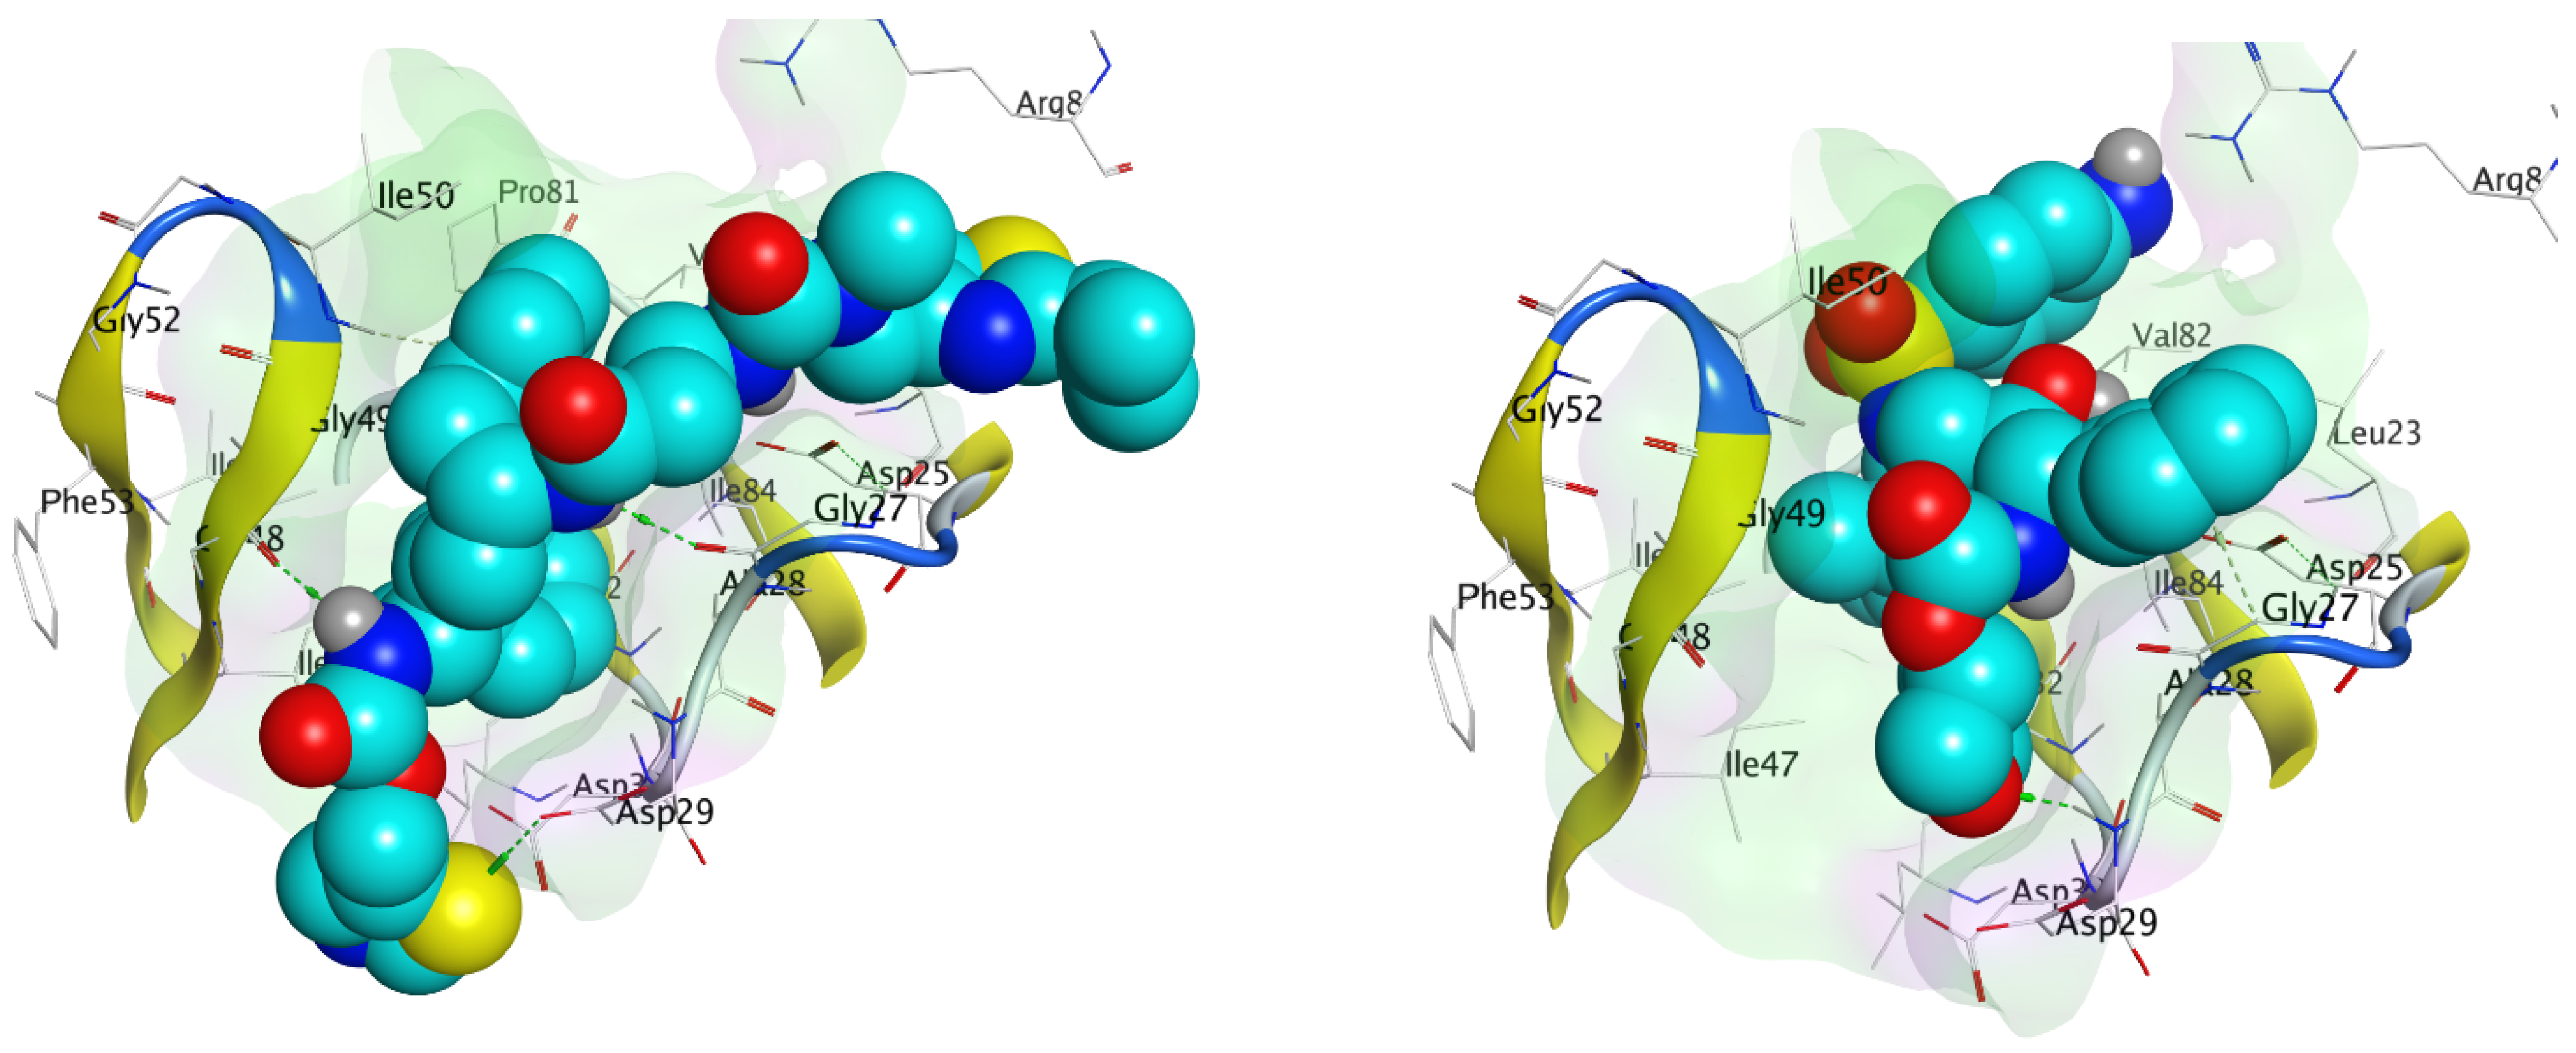
Figure 5.
The docking poses of (a) HPS/002, (b) HPS/004, (c) HPS/006, (d) HPS/007, (e) HPS/008 and (f) HPS/009 in the binding cavity of HIV-1 protease.
Figure 5.
The docking poses of (a) HPS/002, (b) HPS/004, (c) HPS/006, (d) HPS/007, (e) HPS/008 and (f) HPS/009 in the binding cavity of HIV-1 protease.


Figure 6.
The 3D structure of 2Q5K for molecular modeling: (a) publication quality representation, (b) flat ribbon representation (all prepared using Discovery Studio Visualization vs21.1.0.20298).
Figure 6.
The 3D structure of 2Q5K for molecular modeling: (a) publication quality representation, (b) flat ribbon representation (all prepared using Discovery Studio Visualization vs21.1.0.20298).


Table 1.
The physicochemical properties of the selected hits.
| S/N | Comp Code | MW | a_don | a_acc | b_1rotN | logP(o/w) | TPSA Ų | % ABS |
|---|---|---|---|---|---|---|---|---|
| 1 | HPS/001 | 632.78 | 5 | 4 | 15 | 4.97 | 120.00 | 67.60 |
| 2 | HPS/002 | 642.80 | 6 | 4 | 15 | 4.69 | 137.07 | 61.71 |
| 3 | HPS/003 | 632.78 | 5 | 4 | 16 | 4.43 | 120.00 | 67.60 |
| 4 | HPS/004 | 642.80 | 6 | 4 | 15 | 4.69 | 137.07 | 61.71 |
| 5 | Lopinavir | 628.814 | 5 | 4 | 15 | 5.19 | 120.00 | 67.60 |
| 6 | HPS/005 | 720.98 | 3 | 5 | 19 | 4.58 | 129.99 | 64.15 |
| 7 | HPS/006 | 698.93 | 3 | 6 | 18 | 3.09 | 139.22 | 60.97 |
| 8 | HPS/007 | 700.95 | 3 | 6 | 18 | 3.06 | 139.22 | 60.97 |
| 9 | HPS/008 | 676.91 | 3 | 5 | 18 | 4.67 | 125.55 | 65.69 |
| 10 | Ritonavir | 720.96 | 4 | 6 | 18 | 5.00 | 145.78 | 58.71 |
| 11 | HPS/009 | 519.66 | 5 | 3 | 14 | 2.83 | 131.19 | 63.74 |
| 12 | HPS/010 | 505.64 | 5 | 3 | 13 | 2.39 | 131.19 | 63.74 |
| 13 | HPS/011 | 505.64 | 5 | 3 | 13 | 2.39 | 131.19 | 63.74 |
| 14 | HPS/012 | 531.67 | 5 | 3 | 13 | 2.78 | 131.19 | 63.74 |
| 15 | Fosamprenavir | 583.60 | 5 | 2 | 13 | 1.40 | 171.40 | 49.87 |
| 16 | HPS/013 | 489.64 | 4 | 2 | 13 | 3.40 | 110.96 | 70.72 |
| 17 | HPS/014 | 489.64 | 4 | 2 | 13 | 3.40 | 110.96 | 70.72 |
| 18 | HPS/015 | 462.59 | 3 | 2 | 13 | 3.07 | 124.79 | 65.95 |
| 19 | HPS/016 | 490.62 | 5 | 2 | 13 | 3.06 | 105.17 | 72.72 |
| 20 | Amprenavir | 505.64 | 5 | 3 | 11 | 2.39 | 131.19 | 63.74 |
| 21 | HPS/017 | 465.64 | 4 | 2 | 12 | 1.71 | 120.74 | 67.34 |
| 22 | HPS/018 | 574.73 | 6 | 4 | 14 | 3.56 | 131.48 | 63.64 |
| 23 | HPS/019 | 532.69 | 3 | 2 | 14 | 4.48 | 133.23 | 63.03 |
| 24 | HPS/020 | 575.71 | 6 | 4 | 17 | 3.49 | 132.89 | 63.15 |
| 25 | Atazanavir | 704.87 | 7 | 5 | 14 | 4.74 | 171.22 | 49.93 |
| 26 | HPS/021 | 573.71 | 6 | 3 | 13 | 2.70 | 126.43 | 65.38 |
| 27 | HPS/022 | 595.72 | 6 | 3 | 13 | 3.37 | 140.42 | 60.56 |
| 28 | HPS/023 | 574.72 | 6 | 2 | 14 | 2.84 | 117.41 | 68.49 |
| 29 | HPS/024 | 546.66 | 5 | 2 | 12 | 2.49 | 145.46 | 58.81 |
| 30 | Darunavir | 547.70 | 3 | 9 | 12 | 2.9 | 149 | 51.41 |
| 31 | HPS/025 | 645.89 | 7 | 3 | 14 | 5.01 | 125.04 | 65.86 |
| 32 | HPS/026 | 661.89 | 8 | 4 | 14 | 4.86 | 145.27 | 59.92 |
| 33 | HPS/027 | 661.89 | 8 | 4 | 14 | 4.86 | 145.27 | 59.92 |
| 34 | HPS/028 | 569.81 | 6 | 5 | 12 | 5.35 | 105.06 | 72.75 |
| 35 | Nelfinavir | 547.673 | 6 | 3 | 11 | 2.436 | 140.42 | 60.56 |
MW = molecular weight; a_don = number of hydrogen bond donors; a_acc = number of hydrogen bond acceptors; b_1rotN = number of rotatable hydrogen bonds; logP(o/w) = octanol-water partition coefficient; TPSA = topological polar surface area.
Table 2.
Binding free energy (kcal/mol) and the HIV protease inhibitory activity of selected hits from different reference drugs.
Table 2.
Binding free energy (kcal/mol) and the HIV protease inhibitory activity of selected hits from different reference drugs.
| Ref Drug | S/N | Comp Code | ΔG (kcal/mol) | IC50 (µM) | % Inhibition |
|---|---|---|---|---|---|
| Lopinavir | 1 | HPS/001 | −8.28 | 304.89 | 90.15 |
| 2 | HPS/002 | −8.24 | 48.9 | 90.13 | |
| 3 | HPS/003 | −7.91 | 318.74 | 82.65 | |
| 4 | HPS/004 | −7.88 | 48.9 | 90.13 | |
| 5 | Lopinavir | −7.80 | 203.69 | 90.12 | |
| Ritonavir | 6 | HPS/005 | −8.98 | 7.79 | 59.07 |
| 7 | HPS/006 | −8.63 | 31.17 | 59.8 | |
| 8 | HPS/007 | −8.57 | 36.33 | 60.78 | |
| 9 | HPS/008 | −8.54 | 14.58 | 59.48 | |
| 10 | Ritonavir | −8.35 | 24.99 | 53.74 | |
| Fosamprenavir | 11 | HPS/009 | −7.31 | −14.7 | 65.58 |
| 12 | HPS/010 | −7.15 | 6.80 | 65.59 | |
| 13 | HPS/011 | −6.97 | 6.80 | 65.59 | |
| 14 | HPS/012 | −6.91 | −16.04 | 65.57 | |
| 15 | Fosamprenavir | −6.88 | 39.79 | 65.65 | |
| Amprenavir | 16 | HPS/013 | −6.96 | 0.14 | 54.98 |
| 17 | HPS/014 | −6.85 | 0.14 | 54.98 | |
| 18 | HPS/015 | −6.76 | 134.14 | 70.70 | |
| 19 | HPS/016 | −6.72 | 66.22 | 66.11 | |
| 20 | Amprenavir | −6.69 | 6.8 | 65.59 | |
| Atazanavir | 21 | HPS/017 | −8.09 | 28.40 | 59.85 |
| 22 | HPS/018 | −7.87 | −18.12 | 52.71 | |
| 23 | HPS/019 | −7.68 | 168.45 | 54.00 | |
| 24 | HPS/020 | −7.64 | −2.52 | 56.87 | |
| 25 | Atazanavir | −7.63 | 7.88 | 52.48 | |
| Darunavir | 26 | HPS/021 | −8.00 | 50.02 | 61.53 |
| 27 | HPS/022 | −7.50 | 28.2 | 58.64 | |
| 28 | HPS/023 | −7.28 | 1.38 | 61.04 | |
| 29 | HPS/024 | −7.29 | −18.51 | 58.39 | |
| 30 | Darunavir | −7.01 | −0.3 | 55.17 | |
| Nelfinavir | 31 | HPS/025 | −7.94 | −3.48 | 50.47 |
| 32 | HPS/026 | −7.84 | 28.4 | 58.79 | |
| 33 | HPS/027 | −7.60 | 4.92 | 58.79 | |
| 34 | HPS/028 | −7.59 | 1.78 | 56.16 | |
| 35 | Nelfinavir | −7.58 | 9.51 | 50.47 |
Table 3.
Binding interactions of the hit compounds with 2Q5K.
| S/N | Compound | Ligand | Receptor | Interaction | Distance (Å) | E (kcal/mol) |
|---|---|---|---|---|---|---|
| 1 | HPS/002 | O 1 | O GLY 27 | H-donor | 2.94 | −1.9 |
| C 21 | O GLY 27 | H-donor | 3.21 | −0.2 | ||
| C 58 | OD2 ASP 30 | H-donor | 3.60 | −0.2 | ||
| O 6 | N ASP 29 | H-acceptor | 2.94 | −1.6 | ||
| 6-ring | CA GLY 27 | pi-H | 4.28 | −0.2 | ||
| 6-ring | CG1 ILE 50 | pi-H | 4.24 | −0.4 | ||
| 2 | HPS/004 | C 21 | O GLY 27 | H-donor | 3.52 | −0.2 |
| O 3 | N ILE 50 | H-acceptor | 3.37 | −0.8 | ||
| O 6 | N ASP 29 | H-acceptor | 3.22 | −2.4 | ||
| 6-ring | CA ILE 47 | pi-H | 4.54 | −0.2 | ||
| 6-ring | N GLY 48 | pi-H | 3.85 | −1.2 | ||
| 3 | HPS/006 | S 1 | OG1 THR80 | H-donor | 3.73 | −1.2 |
| N 10 | O GLY 27 | H-donor | 3.69 | −0.2 | ||
| C 29 | OD1 ASP 25 | H-donor | 3.12 | −2.6 | ||
| S 1 | CD1 ILE 54 | H-acceptor | 4.11 | −0.2 | ||
| O 4 | CA GLY 49 | H-acceptor | 3.30 | −0.6 | ||
| 4 | HPS/007 | N 8 | O ILE 50 | H-donor | 2.83 | −9.6 |
| C 37 | O GLY 52 | H-donor | 3.13 | −0.7 | ||
| C 68 | OG1 THR80 | H-donor | 3.44 | −0.2 | ||
| C 75 | OD2 ASP 25 | H-donor | 3.32 | −0.3 | ||
| S 2 | CD1 ILE 50 | H-acceptor | 4.27 | −0.2 | ||
| 6-ring | CD1 LEU 23 | pi-H | 4.41 | −0.2 | ||
| 6-ring | CD2 LEU 23 | pi-H | 3.88 | −0.3 | ||
| 5-ring | CD1 LEU 47 | pi-H | 3.72 | −0.4 | ||
| 5 | HPS/008 | S 2 | OD2 ASP 29 | H-donor | 3.54 | −3.2 |
| S 2 | OD1 ASP 30 | H-donor | 3.47 | −0.2 | ||
| N 7 | O GLY 27 | H-donor | 3.41 | −0.6 | ||
| N 9 | O GLY 48 | H-donor | 3.13 | −0.6 | ||
| C 33 | O GLY 27 | H-donor | 3.36 | −0.2 | ||
| N 15 | NZ LYS 45 | H-acceptor | 3.30 | −2.8 | ||
| 6-ring | CD1 ILE 47 | pi-H | 4.18 | −0.8 | ||
| 6-ring | N ILE 50 | pi-H | 3.92 | −1.0 | ||
| 6 | HPS/009 | C 36 | O GLY 27 | H-donor | 3.61 | −0.3 |
| O 7 | N ASP 29 | H-acceptor | 3.05 | −1.9 | ||
| 6-ring | CA GLY 27 | pi-H | 3.63 | −0.6 |
Table 4.
Absorption and distribution (pkCSM).
| Absorption | Distribution | |||||||||||
|---|---|---|---|---|---|---|---|---|---|---|---|---|
| S/N | Comp Code | Water Solubility | Caco2 Perm | Intestine Abs | Skin Perm. | P-GPS | P-GP1I | P-GP2I | VDss | FU | BBB Perm. | CNS Perm. |
| 1 | HPS/001 | −4.788 | −0.162 | 60.891 | −2.735 | Yes | Yes | Yes | −0.362 | 0 | −1.011 | −3.069 |
| 2 | HPS/002 | −4.625 | 0.271 | 61.515 | −2.735 | Yes | Yes | Yes | −0.399 | −0.399 | −0.712 | −3.11 |
| 3 | HPS/003 | −4.741 | −0.246 | 71.033 | −2.735 | Yes | Yes | Yes | −0.31 | 0.019 | −1.35 | −3.154 |
| 4 | HPS/004 | −4.625 | 0.271 | 61.515 | 61.515 | Yes | Yes | Yes | −0.399 | 0.012 | −0.712 | −3.11 |
| 5 | Lopinavir | −2.892 | 1.497 | 76.395 | −2.735 | No | No | No | 0.011 | 0.381 | −1.525 | −1.418 |
| 6 | HPS/005 | −3.84 | 0.216 | 70.919 | −2.735 | Yes | Yes | Yes | 0.702 | 0 | −1.76 | −3.362 |
| 7 | HPS/006 | −4.11 | 0.737 | 71.415 | −2.735 | Yes | Yes | Yes | 0.302 | 0.048 | −1.844 | −3.642 |
| 8 | HPS/007 | −3.209 | 0.464 | 69.849 | −2.735 | Yes | Yes | Yes | 1.105 | 1.105 | −1.789 | −3.895 |
| 9 | HPS/008 | −4.232 | 0.561 | 79.662 | −2.735 | Yes | Yes | Yes | 0.273 | 0 | −1.678 | −3.23 |
| 10 | Ritonavir | −3.358 | 0.377 | 69.45 | −2.735 | Yes | Yes | Yes | 0.429 | 0 | −1.665 | −3.295 |
| 11 | HPS/009 | −3.315 | 0.356 | 66.625 | −2.741 | Yes | Yes | No | 0.639 | 0.093 | −1.081 | −3.461 |
| 12 | HPS/010 | −3.312 | 0.354 | 65.884 | −2.742 | Yes | Yes | No | 0.552 | 0.079 | −1.018 | −3.473 |
| 13 | HPS/011 | −3.312 | 0.354 | 65.884 | −2.742 | Yes | Yes | No | 0.552 | 0.079 | −1.018 | −3.473 |
| 14 | HPS/012 | −3.499 | 0.484 | 71.755 | −2.74 | Yes | Yes | No | 0.603 | 0.03 | −0.974 | −3.413 |
| 15 | Fosamprenavir | −3.239 | 0.201 | 76.433 | −2.735 | Yes | Yes | No | 0.228 | 0.12 | −1.816 | −4.025 |
| 16 | HPS/013 | −3.631 | 0.467 | 81.852 | −2.746 | Yes | Yes | No | 0.569 | 0.012 | −0.919 | −2.991 |
| 17 | HPS/014 | −3.631 | 0.467 | 81.852 | −2.746 | Yes | Yes | No | 0.569 | 0.012 | −0.919 | −2.991 |
| 18 | HPS/015 | −3.494 | −0.099 | 65.218 | −2.735 | Yes | No | No | −0.556 | 0.089 | −1.022 | −3.197 |
| 19 | HPS/016 | −4.52 | 0.613 | 73.02 | −2.812 | Yes | Yes | No | 0.127 | 0 | −1.033 | −3.333 |
| 20 | Amprenavir | −3.312 | 0.354 | 65.884 | −2.742 | Yes | Yes | No | 0.552 | 0.079 | −1.018 | −3.473 |
| 21 | HPS/017 | −3.028 | 0.394 | 74.785 | −2.755 | Yes | Yes | Yes | 1.614 | 0.361 | −0.792 | −2.976 |
| 22 | HPS/018 | −3.511 | −0.247 | 63.672 | −2.735 | Yes | Yes | Yes | 0.325 | 0.107 | −1.222 | −3.158 |
| 23 | HPS/019 | −3.278 | −0.116 | 46.777 | −2.735 | Yes | No | Yes | 0.143 | 0.222 | −0.925 | −2.715 |
| 24 | HPS/020 | −4.316 | 0.288 | 60.286 | −2.741 | Yes | Yes | Yes | 0.053 | 0.05 | −0.964 | −3.071 |
| 25 | Atazanavir | −3.849 | 0.294 | 45.728 | −2.735 | Yes | Yes | Yes | 0.143 | 0.03 | −1.352 | −3.224 |
| 26 | HPS/021 | −3.381 | 0.457 | 80.889 | −2.725 | Yes | Yes | No | 0.776 | 0.046 | −1.076 | −3.474 |
| 27 | HPS/022 | −3.796 | 0.358 | 82.453 | −2.735 | Yes | Yes | Yes | 0.208 | 0 | −1.115 | −3.273 |
| 28 | HPS/023 | −3.401 | 0.51 | 79.453 | −2.738 | Yes | Yes | Yes | 0.148 | 0.242 | −1.15 | −3.47 |
| 29 | HPS/024 | −3.289 | −3.289 | 49.063 | −2.735 | Yes | No | No | 0.06 | 0.164 | −0.921 | −3.656 |
| 30 | Darunavir | −3.348 | 0.493 | 75.477 | −2.739 | Yes | Yes | No | −2.739 | 0.055 | −1.111 | −3.519 |
| 31 | HPS/025 | −4.568 | 0.777 | 69.402 | −2.73 | Yes | Yes | Yes | 0.129 | 0.052 | −0.935 | −2.849 |
| 32 | HPS/026 | −3.711 | 0.265 | 66.903 | −2.735 | Yes | Yes | Yes | 0.31 | 0.139 | −1.099 | −2.911 |
| 33 | HPS/027 | −3.711 | 0.265 | 66.903 | −2.735 | Yes | Yes | Yes | 0.31 | 0.139 | −1.099 | −2.911 |
| 34 | HPS/028 | −3.107 | 0.575 | 70.605 | −2.735 | Yes | Yes | Yes | 0.831 | 0.294 | −0.77 | −2.498 |
| 35 | Nelfinavir | −3.894 | 0.693 | 70.888 | −2.737 | Yes | Yes | Yes | 0.563 | 0.094 | −0.522 | −2.245 |
Caco2 perm.—Caco2 permeability (log Papp in 10−6 cm/s); IA(H)—Intestinal absorption (human); Skin perm—Skin Permeability (log Kp); P-GPS—P-glycoprotein substrate; P-GP1I—P-glycoprotein I inhibitor; P-GP2I—P-glycoprotein II inhibitor; VDss—Volume of distribution at steady state (human) (Log L/kg); FU—Fraction unbound (human) (Fu); BBB perm.—BBB permeability (log BB); CNS perm.—CNS permeability (log PS).
Table 5.
Metabolism and excretion (pkCSM).
| Metabolism | Excretion | |||||||||
|---|---|---|---|---|---|---|---|---|---|---|
| S/N | Comp Code | CYP2D6 Substrate | CYP3A4 Substrate | CYP1A2 Inhibitor | CYP2C19 Inhibitor | CYP2C9 Inhibitor | CYP2D6 Inhibitor | CYP3A4 Inhibitor | Total Clearance (log ml/min/kg) | Renal OCT2 Substrate |
| 1 | HPS/001 | No | Yes | No | Yes | No | No | Yes | 0.335 | No |
| 2 | HPS/002 | No | Yes | No | No | No | No | Yes | 0.429 | Yes |
| 3 | HPS/003 | No | Yes | No | Yes | Yes | No | Yes | 0.371 | No |
| 4 | HPS/004 | No | Yes | No | No | No | No | Yes | 0.429 | No |
| 5 | Lopinavir | No | No | Yes | No | No | No | No | −114.036 | No |
| 6 | HPS/005 | No | Yes | No | No | Yes | No | Yes | 0.613 | No |
| 7 | HPS/006 | No | Yes | No | No | No | No | Yes | 1.122 | No |
| 8 | HPS/007 | No | Yes | No | No | No | No | Yes | 1.202 | No |
| 9 | HPS/008 | No | Yes | No | Yes | Yes | No | Yes | 0.374 | No |
| 10 | Ritonavir | No | Yes | No | No | Yes | No | Yes | 0.564 | No |
| 11 | HPS/009 | No | Yes | No | No | No | No | Yes | 1.021 | No |
| 12 | HPS/010 | No | Yes | No | No | No | No | Yes | 0.918 | No |
| 13 | HPS/011 | No | Yes | No | No | No | No | Yes | 0.918 | No |
| 14 | HPS/012 | No | Yes | No | No | No | No | Yes | 0.755 | No |
| 15 | Fosamprenavir | No | Yes | No | No | No | No | Yes | 0.282 | No |
| 16 | HPS/013 | No | Yes | No | Yes | Yes | No | Yes | 0.782 | No |
| 17 | HPS/014 | No | Yes | No | Yes | Yes | No | Yes | 0.782 | No |
| 18 | HPS/015 | No | No | No | No | No | No | No | 1.06 | No |
| 19 | HPS/016 | No | Yes | No | Yes | No | No | Yes | 1.13 | No |
| 20 | Amprenavir | No | Yes | No | No | No | No | Yes | 0.918 | No |
| 21 | HPS/017 | No | Yes | No | No | No | Yes | Yes | 0.793 | No |
| 22 | HPS/018 | No | Yes | No | Yes | Yes | No | Yes | 0.375 | No |
| 23 | HPS/019 | No | Yes | No | No | No | No | No | 0.378 | No |
| 24 | HPS/020 | No | Yes | No | Yes | Yes | No | Yes | 0.767 | No |
| 25 | Atazanavir | No | Yes | No | No | Yes | No | Yes | 0.258 | No |
| 26 | HPS/021 | No | Yes | No | No | No | No | Yes | 0.439 | No |
| 27 | HPS/022 | No | Yes | No | No | Yes | No | Yes | 0.467 | No |
| 28 | HPS/023 | No | Yes | No | No | No | No | Yes | 0.491 | No |
| 29 | HPS/024 | No | Yes | No | No | No | No | No | 0.654 | No |
| 30 | Darunavir | No | Yes | No | No | No | No | Yes | 0.622 | No |
| 31 | HPS/025 | No | Yes | No | No | No | No | Yes | 0.439 | No |
| 32 | HPS/026 | No | Yes | No | No | No | No | Yes | −0.117 | No |
| 33 | HPS/027 | No | Yes | No | No | No | No | Yes | −0.117 | No |
| 34 | HPS/028 | Yes | Yes | No | No | No | Yes | No | 0.447 | No |
| 35 | Nelfinavir | No | Yes | No | Yes | No | Yes | Yes | 0.399 | No |
Table 6.
The results of the toxicity test with ProToxII.
| S/N | Comp Code | LD50 mg/kg | Toxici-ty Class | Average Similarity | Prediction Accuracy % | Hepatotoxicity | Carcino-Genicity | Immuno-Toxicity | Muta-Genicity | Cytotoxicity | Aroma-Tase | Estrogen Receptor-α | Androgen Receptor | PPAR-γ |
|---|---|---|---|---|---|---|---|---|---|---|---|---|---|---|
| 1 | HPS/001 | 5000 | V | 61.43 | 68.07 | Inactive a | Inactive a | Inactive a | Inactive a | Inactive a | Inactive a | Inactive a | Inactive a | Inactive a |
| 2 | HPS/002 | 5000 | V | 58.87 | 67.38 | Inactive a | Inactive a | Inactive a | Inactive a | Inactive a | Inactive a | Inactive a | Inactive a | Inactive a |
| 3 | HPS/003 | 5000 | V | 61.99 | 68.07 | Inactive a | Inactive | Inactive a | Inactive a | Inactive a | Inactive a | Inactive a | Inactive a | Inactive a |
| 4 | HPS/004 | 5000 | V | 58.87 | 67.38 | Inactive a | Inactive a | Inactive a | Inactive a | Inactive a | Inactive a | Inactive a | Inactive a | Inactive a |
| 5 | Lopinavir | 5000 | V | 59.88 | 67.38 | Inactive a | Inactive a | Inactive a | Inactive a | Inactive a | Inactive a | Inactive a | Inactive a | Inactive a |
| 6 | HPS/005 | 1000 | IV | 40.75 | 54.26 | Active | Inactive | Inactive | Inactive | Inactive | Inactive a | Inactive a | Inactive a | Inactive a |
| 7 | HPS/006 | 800 | IV | 42.36 | 54.26 | Inactive | Inactive | Inactive a | Inactive | Inactive | Inactive a | Inactive a | Inactive a | Inactive a |
| 8 | HPS/007 | 1000 | IV | 42.53 | 54.26 | Inactive | Inactive | Inactive a | Inactive | Inactive | Inactive a | Inactive a | Inactive a | Inactive a |
| 9 | HPS/008 | 500 | IV | 40.28 | 54.26 | Inactive | Inactive | Inactive a | Inactive | Inactive | Inactive a | Inactive a | Inactive a | Inactive a |
| 10 | Ritonavir | 1000 | IV | 42.32 | 54.26 | Active a | Inactive | Inactive a | Inactive a | Inactive | Inactive a | Inactive a | Inactive a | Inactive a |
| 11 | HPS/009 | 300 | III | 48.58 | 54.26 | Inactive | Inactive | Inactive a | Inactive a | Inactive | Inactive a | Inactive a | Inactive a | Inactive a |
| 12 | HPS/010 | 300 | III | 48.58 | 54.26 | Inactive a | Inactive | Inactive a | Inactive a | Inactive | Inactive a | Inactive a | Inactive a | Inactive a |
| 13 | HPS/011 | 300 | III | 48.58 | 54.26 | Inactive a | Inactive | Inactive a | Inactive a | Inactive | Inactive a | Inactive a | Inactive a | Inactive a |
| 14 | HPS/012 | 300 | III | 48.12 | 54.26 | Inactive | Inactive | Inactive a | Inactive a | Inactive | Inactive a | Inactive a | Inactive a | Inactive a |
| 15 | Fosamprenavir | 300 | III | 43.99 | 54.26 | Inactive a | Inactive | Inactive a | Inactive | Inactive | Inactive a | Inactive a | Inactive a | Inactive a |
| 16 | HPS/013 | 300 | III | 50.25 | 67.38 | Inactive a | Inactive | Inactive a | Inactive a | Inactive | Inactive a | Inactive a | Inactive a | Inactive a |
| 17 | HPS/014 | 300 | III | 50.25 | 67.38 | Inactive a | Inactive | Inactive a | Inactive a | Inactive | Inactive a | Inactive a | Inactive a | Inactive a |
| 18 | HPS/015 | 2500 | V | 51.48 | 67.38 | Inactive | Inactive | Inactive a | Inactive a | Inactive | Inactive a | Inactive a | Inactive a | Inactive a |
| 19 | HPS/016 | 1000 | IV | 48.28 | 54.26 | Inactive a | Inactive | Inactive a | Inactive a | Inactive | Inactive a | Inactive a | Inactive a | Inactive a |
| 20 | Amprenavir | 300 | III | 48.58 | 54.26 | Inactive a | Inactive | Inactive a | Inactive a | Inactive | Inactive a | Inactive a | Inactive a | Inactive a |
| 21 | HPS/017 | 200 | III | 47.45 | 54.26 | Active | Active | Active a | Inactive | Inactive | Inactive a | Inactive a | Inactive a | Inactive a |
| 22 | HPS/018 | 200 | III | 44.60 | 54.26 | Inactive | Inactive | Inactive a | Inactive | Inactive | Inactive a | Inactive a | Inactive a | Inactive a |
| 23 | HPS/019 | 500 | IV | 60.36 | 68.07 | Inactive | Inactive | Inactive a | Inactive a | Inactive | Inactive a | Inactive a | Inactive a | Inactive a |
| 24 | HPS/020 | 200 | III | 48.94 | 54.26 | Inactive | Inactive | Inactive a | Inactive | Inactive | Inactive a | Inactive a | Inactive a | Inactive a |
| 25 | Atazanavir | 200 | III | 47.65 | 54.26 | Active | Inactive | Inactive a | Inactive | Inactive | Inactive a | Inactive a | Inactive a | Inactive a |
| 26 | HPS/021 | 245 | III | 48.68 | 54.26 | Active | Inactive | Active | Inactive | Inactive | Inactive a | Inactive a | Inactive a | Inactive a |
| 27 | HPS/022 | 245 | III | 48 | 54.26 | Active | Inactive | Active | Inactive | Inactive | Inactive a | Inactive a | Inactive a | Inactive a |
| 28 | HPS/023 | 245 | III | 50.43 | 67.38 | Active | Active | Active | Inactive | Inactive | Inactive a | Inactive a | Inactive a | Inactive a |
| 29 | HPS/024 | 3000 | V | 47.04 | 54.26 | Active | Inactive | Inactive a | Inactive | Inactive | Inactive a | Inactive a | Inactive a | Inactive a |
| 30 | Darunavir | 245 | III | 52.42 | 67.38 | Active a | Inactive | Inactive | Inactive | Inactive | Inactive a | Inactive a | Inactive a | Inactive a |
| 31 | HPS/025 | 1000 | IV | 45.27 | 54.26 | Inactive | Inactive | Active a | Inactive | Inactive | Inactive a | Inactive a | Inactive a | Inactive a |
| 32 | HPS/026 | 1000 | IV | 43.19 | 54.26 | Inactive | Inactive | Active a | Inactive | Inactive | Inactive a | Inactive a | Inactive a | Inactive a |
| 33 | HPS/027 | 1000 | IV | 43.19 | 54.26 | Inactive | Inactive | Active a | Inactive | Inactive | Inactive a | Inactive a | Inactive a | Inactive a |
| 34 | HPS/028 | 1000 | IV | 45.52 | 54.26 | Inactive | Inactive | Active a | Inactive a | Inactive | Inactive a | Inactive a | Inactive a | Inactive a |
| 35 | Nelfinavir | 600 | IV | 49.30 | 54.26 | Inactive | Inactive | Active a | Inactive a | Inactive | Inactive a | Inactive a | Inactive a | Inactive a |
a High probability (≥0.70); Peroxisome Proliferator Activated Receptor Gamma (PPAR-Gamma).
Table 7.
The results of the toxicity evaluation with pkCSM.
| S/N | Comp Code | AMES Toxicity | Max. Tolerated Dose (Human) | hERG I Inhibitor | hERG II Inhibitor | (LD50) mol/kg | (LOAEL) log mg/kg_bw/day | Hepatotoxicity | Skin Sensitization | T.Pyriformis Toxicity | Minnow Toxicity |
|---|---|---|---|---|---|---|---|---|---|---|---|
| 1 | HPS/001 | No | −0.272 | No | Yes | 2.413 | 3.504 | Yes | No | 0.286 | −1.564 |
| 2 | HPS/002 | No | −0.254 | No | Yes | 2.38 | 2.979 | Yes | No | 0.285 | −1.219 |
| 3 | HPS/003 | No | −0.198 | No | Yes | 2.8 | 3.389 | Yes | No | 0.285 | −2.213 |
| 4 | HPS/004 | No | −0.254 | No | Yes | 2.674 | 3.842 | Yes | No | 0.285 | −1.219 |
| 5 | Lopinavir | No | −0.297 | No | Yes | 2.382 | 5.949 | Yes | No | 0.286 | −1.501 |
| 6 | HPS/005 | No | −0.22 | No | Yes | 2.818 | 3.631 | Yes | No | 0.285 | 4.55 |
| 7 | HPS/006 | No | −0.224 | No | Yes | 3.206 | 2.454 | Yes | No | 0.285 | 1.04 |
| 8 | HPS/007 | No | −0.3 | No | Yes | 2.714 | 2.126 | Yes | No | 0.285 | 1.197 |
| 9 | HPS/008 | No | −0.308 | No | Yes | 2.661 | 2.169 | Yes | No | 0.286 | 1.535 |
| 10 | Ritonavir | No | 0.096 | No | Yes | 2.703 | 2.231 | Yes | No | 0.285 | 1.787 |
| 11 | HPS/009 | No | 0.021 | No | No | 2.578 | 1.744 | Yes | No | 0.285 | −3.865 |
| 12 | HPS/010 | No | 0 | No | No | 2.617 | 1.767 | Yes | No | 0.285 | −4.033 |
| 13 | HPS/011 | No | 0 | No | No | 2.617 | 1.767 | Yes | No | 0.285 | −4.033 |
| 14 | HPS/012 | No | −0.16 | No | No | 2.69 | 1.663 | Yes | No | 0.285 | −4.327 |
| 15 | Fosamprenavir | No | −0.029 | No | No | 2.396 | 2.151 | Yes | No | 0.285 | −4.393 |
| 16 | HPS/013 | No | −0.355 | No | No | 2.415 | 1.989 | Yes | No | 0.293 | −3.9 |
| 17 | HPS/014 | No | −0.355 | No | No | 2.415 | 1.989 | Yes | No | 0.293 | −3.9 |
| 18 | HPS/015 | No | −0.29 | No | No | 2.282 | 1.904 | Yes | No | 0.285 | −1.634 |
| 19 | HPS/016 | No | −0.048 | No | No | 3.255 | 1.823 | Yes | No | 0.286 | −4.231 |
| 20 | Amprenavir | No | 0 | No | No | 2.617 | 1.767 | Yes | No | 0.285 | −4.033 |
| 21 | HPS/017 | Yes | −0.295 | No | Yes | 2.528 | 1.731 | Yes | No | 0.286 | 0.934 |
| 22 | HPS/018 | No | 0.178 | No | Yes | 2.805 | 5.592 | Yes | No | 0.285 | 1.481 |
| 23 | HPS/019 | No | 0.256 | No | Yes | 2.567 | 4.603 | Yes | No | 0.285 | 0.939 |
| 24 | HPS/020 | No | −0.419 | No | Yes | 3.317 | 0.624 | Yes | No | 0.286 | 0.553 |
| 25 | Atazanavir | No | −0.16 | No | No | 2.665 | 2.703 | Yes | No | 0.285 | 2.075 |
| 26 | HPS/021 | No | −0.914 | No | No | 2.702 | 1.716 | Yes | No | 0.29 | 0.501 |
| 27 | HPS/022 | No | −0.353 | No | Yes | 2.434 | 2.96 | Yes | No | 0.286 | −0.052 |
| 28 | HPS/023 | No | −0.504 | No | Yes | 2.088 | 2.666 | Yes | No | 0.285 | 0.463 |
| 29 | HPS/024 | No | −0.105 | No | No | 2.535 | 2.336 | Yes | No | 0.285 | 1.082 |
| 30 | Darunavir | No | −0.763 | No | No | 2.107 | 2.775 | Yes | No | 0.289 | 0.61 |
| 31 | HPS/025 | No | −0.831 | No | Yes | 2.566 | 2.949 | Yes | No | 0.29 | 0.501 |
| 32 | HPS/026 | No | −0.575 | No | Yes | 2.538 | 3.508 | Yes | No | 0.285 | 1.725 |
| 33 | HPS/027 | No | −0.575 | No | Yes | 2.538 | 3.508 | Yes | No | 0.285 | 1.725 |
| 34 | HPS/028 | No | 0.019 | No | Yes | 2.379 | 4.271 | Yes | No | 0.285 | 2.047 |
| 35 | Nelfinavir | No | −0.576 | No | Yes | 2.54 | 3.911 | Yes | No | 0.287 | 1.236 |
Publisher’s Note: MDPI stays neutral with regard to jurisdictional claims in published maps and institutional affiliations. |
© 2022 by the authors. Licensee MDPI, Basel, Switzerland. This article is an open access article distributed under the terms and conditions of the Creative Commons Attribution (CC BY) license (https://creativecommons.org/licenses/by/4.0/).
Share and Cite
MDPI and ACS Style
Okafor, S.N.; Angsantikul, P.; Ahmed, H. Discovery of Novel HIV Protease Inhibitors Using Modern Computational Techniques. Int. J. Mol. Sci. 2022, 23, 12149. https://doi.org/10.3390/ijms232012149
AMA Style
Okafor SN, Angsantikul P, Ahmed H. Discovery of Novel HIV Protease Inhibitors Using Modern Computational Techniques. International Journal of Molecular Sciences. 2022; 23(20):12149. https://doi.org/10.3390/ijms232012149
Chicago/Turabian StyleOkafor, Sunday N., Pavimol Angsantikul, and Hashim Ahmed. 2022. "Discovery of Novel HIV Protease Inhibitors Using Modern Computational Techniques" International Journal of Molecular Sciences 23, no. 20: 12149. https://doi.org/10.3390/ijms232012149
Note that from the first issue of 2016, this journal uses article numbers instead of page numbers. See further details here.