
Optimization of LIB Electrolyte and Exploration of Novel Compounds via the Molecular Dynamics Method
by
 ,
,
Ken-ichi Saitoh
1,* ,
,
Yoshihiro Takai
2,
Tomohiro Sato
1,
Masanori Takuma
1 and
Yoshimasa Takahashi
1 1
Department of Mechanical Engineering, Faculty of Engineering Science, Kansai University, Suita-shi 564-8680, Osaka, Japan
2
Toyota Auto Body, Co., Ltd., Kariya-shi 448-8666, Aichi, Japan
*
Author to whom correspondence should be addressed.
Batteries 2022, 8(3), 27; https://doi.org/10.3390/batteries8030027
Submission received: 24 January 2022
/
Revised: 14 March 2022
/
Accepted: 17 March 2022
/
Published: 21 March 2022
Abstract
:Due to great interest in the development of electric vehicles and other applications, improving the performances of lithium-ion batteries (LIBs) is crucial. Specifically, components of electrolytes for LIBs should be adequately chosen from hundreds of thousands of candidate compounds. In this study, we aimed to evaluate some physical properties expected for combinations of molecules for electrolytes by microscopic simulations. That is, the viscosity, ionic conductivity, degree of dissociation, diffusion coefficient, and conformation of each molecule were analyzed via molecular dynamics (MD) simulations. We aimed to understand how molecular-sized structures and properties collaboratively affect the behavior of electrolytes. The practical models of molecules we used were ethylene carbonate (EC), fluoroethylene carbonate (FEC), propylene carbonate (PC), butylene carbonate (BC), γ-butyrolactone (GBL), γ-valerolactone (GVL), dimethyl carbonate (DMC), ethyl-methyl carbonate (EMC), diethyl carbonate (DEC), and lithium hexafluorophosphate (LiPF6). Many molecular systems of electrolytes were simulated, in which one molar LiPF6 was mixed into a single or combined solvent. It was found that small solvent molecules diffused with relative ease, and they contributed to the higher ionic conductivity of electrolytes. It was clarified that the diffusion coefficient of lithium (Li) ions is greatly affected by the surrounding solvent molecules. We can conclude that high-permittivity solvents can be selectively coordinated around Li ions, and Li salts are sufficiently dissociated, even when there is only a small content of high-permittivity solvent. Thus, we can confirm solely by MD simulation that one of the better candidates for solvent molecules, formamide (F), will exhibit higher performance than the current solvents.
1. Introduction
In recent years, new technologies have become important to avoid future global warming. Instead of using fossil fuels, we must shift to sustainable energy resources, such as solar and wind power generation, and electric vehicles should become widespread in the near future. However, electric cars still have limitations in cruising distance due to the insufficient capacity of batteries and their long charging times. To solve these issues, a more compact and lightweight battery with a large capacity and rapid charging time is required. As is well known, lithium-ion batteries (LIBs) are widespread as rechargeable batteries and are leading the market. However, safety problems are often reported for LIBs, and the issue of their output power is also known. To satisfy these requirements, researchers are now trying to develop new rechargeable batteries called “innovative batteries” [1,2,3], which operate differently from LIBs, including all-solid-state batteries [4]. However, since a high operating voltage and large capacity are demanded for rechargeable batteries, the lithium-ion type is still leading in industry, and it resolves the issues above. In addition, LIBs have recently developed and enhanced their safety [5], and many researchers are making an effort to improve their performances.
To improve the performances of LIBs, many researchers have studied materials of electrodes and electrolytes. A thin film called a solid electrolyte interphase (SEI) is often formed by the decomposition of electrolyte on the surface of the negative electrode. Additionally, lithium ions (Li+) are incorporated into the negative electrode, which suppresses further decomposition of the electrolyte. This mechanism will reduce the battery life and is unfavorable. Many researchers are studying the processes of SEI formation and growth [6,7,8,9]. It is also reported that when an organic solvent made of fluorine compounds is used, an electrolyte will improve the performance of the negative electrode, owing to better SEI formation [10]. Recently, a theoretical study using molecular simulation techniques has been applied to see the detailed SEI mechanism and started to produce insightful results to complement the experimental studies effectively [11].
In general, the fundamental role of the electrolyte is to mediate ion transport between the electrodes. The transport performance of ions in the electrolyte is characterized well by ionic conductivity, and it is an important research subject to seek the electrolyte material that will improve ionic conductivity. Thus far, the main electrolyte used for the battery is a solution using lithium hexafluorophosphate (LiPF6) mixed in organic solvents. Among some lithium salts, it is said that LiPF6 fits LIBs because of its high resistance to oxidation. Several carbonate solvents which have been used in many ordinary LIBs are ethylene carbonate (EC), fluoroethylene carbonate (FEC), propylene carbonate (PC), butylene carbonate (BC), γ-butyrolactone (GBL), γ-valerolactone (GVL), dimethyl carbonate (DMC), ethyl-methyl carbonate (EMC), and diethyl carbonate (DEC). Among these solvents, EC, FEC, PC, BC, GBL, and GVL are high-permittivity solvents (HPS) that can promote salt dissociation but with high viscosity, whereas DMC, EMC, and DEC are called low-viscosity solvents (LVS) that play a role in lowering the viscosity of an electrolyte solution. Therefore, currently, there is no single type of solvent to furnish all the desirable properties, so the industry is making an effort to design electrolyte solutions to produce high ionic conductivity by mixing HPS and LVS [12]. These carbonate-type electrolytes that we will investigate in the present paper, and ionic liquids for electrolytes, seem popular, and their experimental data already exist [13,14,15]. On the other hand, theoretical and nano-scale information should be scrutinized by using microscopic-simulation methodology.
Previous studies [16,17,18] reported that ionic conductivity depends on the temperature, solution viscosity, degree of salt dissociation, and diffusion coefficient of the ions. The “solvation” values have also been found, which means a solvated configuration of molecules where a single lithium ion is sterically surrounded by several solvent molecules. The solvation structure around Li+ has been studied by experimental techniques, such as Fourier transform infrared (FTIR) spectroscopy [19,20], Raman spectroscopy [21], and nuclear magnetic resonance (NMR) spectroscopy [21,22]. Some studies have attempted to determine the number of coordinating molecules around the Li+ ion. The reported coordination numbers in experiments range from 2 to 5. However, there has been relatively little experimental characterization of the details of the coordination structures in LIBs, and molecular simulations are expected to provide such microscopic insights [23,24,25,26,27,28]. The solvation is caused by the dielectric polarization of solvent molecules, which depends on the intensity of Coulomb interaction (electrostatic force). It is guessed that lithium ions that are forming the solvation are to migrate through electrolyte liquids, so it is crucial to understand the relationship between the physical (mainly transport) properties and the actual configuration of lithium ions.
To develop novel batteries with higher performance, discovering new substances for electrolytes or electrodes is necessary. For electrolytes in particular, there are hundreds of thousands of candidate compounds, so we must explore them and choose good ones from among them. Thus, we should try to establish a methodology using the molecular dynamics (MD) simulation method to investigate the physical and structural properties of electrolytes useable in LIBs and to assess the best structure of electrolyte molecules. In many cases recently, simulation studies have been recognized to be suitable for inquiring about the microscopic mechanisms of electrolytes and their unknown physical properties. Additionally, this type of study will become an essential methodology to complement somewhat limited experimental data [29,30,31]. The discussion of this paper focuses on the mutual correlations among many properties, such as the molecular sizes of solvents, solvation structures, diffusion coefficients, ionic conductivity, and coordination numbers of Li+ (lithium ions), in LIB electrolytes. In addition, we characterize “the selective solvation”, in which electrolytes have desired properties, such as a high degree of dissociation and low viscosity at the same time. The correlations between properties for the selected solvation structure guide us to discover other substances that can be considered for better electrolytes and better solvation structures in the future.
2. Computational Details and Models
2.1. Computational Procedure
We simulated models of electrolyte solutions by using the MD method, and then analyzed their microscopic dynamics and their macroscopic physical properties. In this study, we utilized “GROMACS” [32], which has been developed as a general-purpose and parallelizable software package for molecular simulation. The force field employed for all MD simulations here was derived from “Assisted Model Building with Energy Refinement (AMBER)” software [33]. Compared with other molecular simulation software, we found that the atomistic simulation procedure by GROMACS and AMBER used here is preferable for electrolyte materials, including hydro-carbonate molecules such as those used in this study.
As solvent molecules are usually categorized into either HPS or LVS electrolytes, we observed several molecular models in MD simulation as stated above: EC, FEC, PC, BC, GBL, GVL, DMC, EMC, DEC, and formamide. Among them, EC, FEC, PC, BC, GBL, GVL, and formamide are supposed to be in the HPS group with high conductivity but high viscosity (low fluidity). On the other hand, DMC, EMC, and DEC are in the LVS group, which has low conductivity but low viscosity (high fluidity). We understand that the differences between two groups are primarily brought about by their molecular shape.
In the actual manufacturing of electrolytes, the molecule of salt is typically lithium hexafluorophosphate (LiPF6). LiPF6 is a frequently used salt in the electrolyte as it exhibits high ionic conductivity [24,34]. It dissociates into a Li+ cation and a PF6− anion in solvation. All solution models of electrolytes were prepared by mixing 1.0 mol/L salt with solvents (i.e., 1M-LiPF6). A cubic-shaped and three-dimensionally periodic cell for MD simulation was prepared. The MD cell included 500 LiPF6 molecules and a given number of solvent molecules, where positions of molecules were assigned randomly without overlapping. This procedure was accomplished by using “packmol” [35], which is software that creates the initial structure of molecules in liquid state in a periodic MD cell. Table 1 shows the details of molecular compositions for every electrolyte model.
As shown in Table 1a, the simulation models composed of single molecular types were denoted by their molecular names (nine types in total), that is, EC, FEC, PC, BC, GBL, GVL, DMC, EMC, and DEC. On the other hand, simulation models of mixed solvents comprised one type of HPS molecule (with high permittivity, i.e., EC) and one of three types of LVS molecules (with low viscosity, i.e., EMC, DMC, or DEC). The composition of HPS molecules to LVS ones was changed every 10 percent, from 10 to 90 percent. Consequently, there were nine models of mixed solvents. As shown in Table 1b, the labels of mixed solvents were given such that a single digit represented the composition of solvent molecules.
The system temperature was kept at 300 K by a Nose–Hoover thermostat [36,37], and the pressure was controlled at standard atmospheric condition (100 kPa) by a Parrinello–Rahman barostat [38]. For calculating long-range Coulomb forces effectively, the Particle Mesh Ewald (PME) method [39] was applied. In the PME method, the ordinary process of the Ewald method for the summation of Coulomb interactions is divided into short- and long-range parts. Using a cut-off length of 1.0 nm for the short-range part, Coulomb interaction can be evaluated with sufficient accuracy.
Structural relaxation of the molecular system of the electrolytes was performed as follows. First, the total system was calculated keeping constant volume at constant temperature using the NVT ensemble for 0.5 nanoseconds (ns). Subsequently, it was equilibrated under constant temperature and pressure using the NPT ensemble for 0.5 ns, which resulted in density optimization of the electrolyte system. After, it was calculated again under the NVT ensemble for 1.0 ns to evaluate physical properties and obtain molecular behavior. The properties and behavior include the degree of salt dissociation, viscosity, diffusion coefficients of solvents and ions, and solvation structure. Finally, a non-equilibrium MD simulation was conducted with the NVT ensemble for 2.0 ns with a uniform electric field of 0.8 V/nm, and ionic conductivity of the system was evaluated. The time increment of all the MD simulations was set to be 1.0 femtosecond (fs).
2.2. Estimation of Electric Conductivity and Diffusivity of Ions
In discussing the performance of an electrolyte solution, the most important physical property is the ionic conductivity κ. In general, the mutual relationship among κ, the degree of dissociation, and the diffusion coefficient of ion is explained analytically by the following Nernst–Einstein relation:
where e, , , , , , and represent the elementary charge, the Avogadro number, the Boltzmann constant, temperature, the degree of dissociation, and the diffusion coefficients of the anion and cation, respectively. The importance of this relation is that ionic conductivity is proportional to the averaged diffusivity of constitutive ions. As explained in the previous section, the ionic conductivity κ of electrolyte solution was computationally estimated from a non-equilibrium MD simulation in which an electric field E was applied under an NVT ensemble. As shown in Figure 1, an example snapshot of the non-equilibrium molecular system, every ion is driven primarily in the direction of the electric field, which was applied to the calculation cell (in the figure, it is in the direction of left to right). As confirmed by us previously [40,41], the electric current of the total system, I(t), can be calculated by summing up the product between charge and displacement of all ions, as expressed by Equation (2). Then, ionic conductivity can be obtained directly from Equation (3), where the electric current is divided by the cross-sectional area perpendicular to the current and by the magnitude of electric field.
where and are the electric charge and the x position of the ion labeled by ; is the side length of the basic cell; and t and are time and its increment.
The viscosity of electrolyte solution greatly influences the ionic conductivity, so estimation of the viscosity of the system is crucial. It is well known that viscosity in the molecular system can be estimated by applying the Green–Kubo relation to atomic trajectories obtained from equilibrium MD run, or it is extracted directly from non-equilibrium-type MD calculation. However, in general, the Green–Kubo relation has a drawback in that the MD calculation requires a very long time, and too high of a computational cost is needed. Additionally, the viscosity obtained in the non-equilibrium calculation is far from that in an equilibrium state. Therefore, a theory-assisted computational method, called the Transverse-Current Auto-correlation Function (TCAF) [42], was successfully used to evaluate the viscosity in this study. With a low computational cost, TCAF is capable of estimating the viscosity from momentum field of the system in equilibrium state.
From the macroscopic viewpoint, the diffusion coefficient D correlates to temperature , viscosity , and Stokes radius , via the Stokes–Einstein relation:
We might assume in the case of a uniform electrolyte that the radius of solvent molecules is equivalent to the Stoke radius in this equation. Then, the equation means that the diffusivity should be reciprocally proportional to the radius of solvent molecules. Both and in this equation can be estimated in an equilibrium MD simulation. Additionally, the diffusion coefficient of solvents or ions is calculated from the mean square displacement (MSD) of atoms in the system, which is continuously monitored at each time by Equation (5) (called Einstein’s relation):
where represents the position vector of an atom , and the triangular brackets 〈 ∙ 〉 indicate an ensemble average or, equivalently, a time and molecular average. Accordingly, the Stokes–Einstein relation can be confirmed just by MD simulations, and we check this in our simulation results later in Section 3.1.
A commonly used measure to identify a specific liquid structure on a molecular scale is the radial distribution function (RDF) . The RDF focuses on one atom and means a radial distribution of other atoms around it in the form of density over distance r. In this study, the structure of the solvation shell around a Li+ ion was scrutinized by using the RDF. When the RDF is integrated over an adequate volume, the number of atoms that are involved in a coordination shell can be estimated. It was determined in a previous study that the first solvation shell from one Li+ ion should be formed within 0.25 nm [43].
The degree of dissociation of a salt molecule can be simply defined as the atomic distance between elements Li and P [43]. When the Li atom is at a position separated more than 0.4 nm from the P atom, LiPF6 was determined to be in a dissociated state. When the number of Li+ ions in the dissociated state is and the total number of LiPF6 molecules is , the degree of dissociation α should be simply defined by the following equation:
3. Results and Discussion
3.1. Single-Solvent + 1M-LiPF6 Electrolyte Solutions
Simple electrolyte solution models, which are produced by mixing 1M-LiPF6 into one type of solvent molecule (as shown above in Table 1a), were put into the MD simulation procedure, and the results were compared. Some physical properties were considered for the results of these models, and correlations between those properties were investigated.
First, to see how much the molecular simulation agrees with a corresponding experiment, the correlation was checked. Figure 2 shows the comparison of properties ((a) density, (b) diffusion coefficient, and (c) viscosity) obtained by our simulation and those obtained by experiments in the literature [44,45,46] (those were completed at room temperature and in atmospheric pressure). We found allowable agreement between experiments and simulations, although some discrepancies remain. The difference is due partly to the fact that simulations were very microscopically focused and relatively short, and therefore, the fluctuation of each property tended to be larger than that in a real experiment. Besides this, we should realize the limitation in terms of the accuracy of force-field modeling (one of the best at present was utilized here). However, no critical difference in the order of magnitude was confirmed for each molecule, so we recognize sufficient reliability in our simulated data.
Figure 3 shows the variation in size of the solvation shell, which was estimated for each of the electrolyte solutions. As shown in Figure 3, it is well known that the lithium ion (Li+) will have a certain solvated structure, where the cation is sterically surrounded by several solvent molecules [23,24,25,26,27,28]. For a LiPF6 salt molecule to dissociate, the Li+ ion should be fully surrounded by other solvent molecules. A previous study [24] reported that a linear-type molecule, such as DMC, due to its shape, tends to interfere with other molecules that are to be coordinated to the Li+ ion; therefore, it is an unfavorable molecule to establish effective coordination around the cation. Additionally, in this study, as shown in Figure 3b, it was observed that one of the DMC molecules near the Li+ ion was greatly deformed. This result indicates that the tendency to form effective coordination to one Li+ ion greatly depends on the molecular shape of solvents.
Figure 4 shows the correlation between the molecular radius of the solvent and the coordination number of Li+ ions, which was observed and averaged during the MD simulation. It was found that approximately four molecules were coordinated to one Li+ ion for solvents categorized into HPS. A solution composed of HPS-type solvents has a high dielectric constant; therefore, it will promote the dissociation of lithium salts. On the other hand, in LVS-type solvents, the solution cannot satisfactorily dissociate lithium salts, so the number of solvent molecules coordinated to the Li+ ion was reduced to around three. This situation means that three solvent molecules and one anion, PF6−, are arranged around the centered cation, Li+, but the salt itself is not fully dissociated yet. It is understood that it is difficult for this type of solvent molecule to neatly coordinate to a lithium ion due to their relatively large size. Figure 5 shows the correlation between the molecular radii of solvent molecules and the degree of dissociation. As shown in Figure 5 (a dashed green or a blue line represents an approximation for the HPS or LVS solvent, respectively), whether the solvent is HPS or LVS, the smaller the molecular size of the solvent, the higher the degree of dissociation that will be realized. Compared with experimental results (at room temperature) for the HPS group [18], the degree of dissociation was estimated at between 0.6 and 0.7, which is a little smaller than our computation. However, the dependency of the molecular size found here is like that observed in the experiment [18].
According to the Stokes–Einstein relation, Equation (4), the diffusion coefficient is related to temperature , viscosity , and Stokes radius R. The Stokes radius represents a kind of virtual radius of a molecule diffusing in the solvation shell. In this study, we regard R as the characteristic radius of the solvent molecule, because we can expect that there is a correlation between the radii of solvent molecules and the sizes of their solvation shells. In Figure 6, the abscissa is the product of the viscosities and radii of solvent molecules, and the ordinate is the diffusion coefficient calculated from MD simulations. The dashed blue line is based on the MD simulation, whereas the dashed green line is a theoretical value based on the Stokes–Einstein relation, Equation (4). Although the type of curve is similar, the simulated diffusion coefficient seems to be much larger than the theoretical one. This discrepancy might be brought about by the fact that the viscosity obtained in the MD calculation is usually smaller than the actual value, and a molecular radius was calculated under the assumption of a perfect sphere. However, basically, the theory and MD results qualitatively agree well. Thus, it was concluded that the diffusion coefficient strongly depends on the radius of the solvent molecule.
As stated above, the Li+ ion in the electrolyte solution forms a solvation shell composed of solvent molecules, so it is natural that the diffusion coefficient of the Li+ ion is influenced by that of the solvent. Therefore, the radius of the solvent molecule indirectly affects the diffusion coefficient of the Li+ ion. Figure 7 shows the relation between diffusion coefficients of the solvent (or ) and for ions. As expected, it was found that and increase proportionally with increasing . We also found a relationship of < for HPS-type solvents. This is due to the largeness of the diffusion radius of HPS. In those solvents, the lithium salt tends to dissociate into Li+ and PF6−, and this results in the formation of a solvation shell with radius larger than that of Li+ itself. Consequently, the solvation shell will migrate into one diffusional body.
The ionic conductivity is related not only to the degree of dissociation of the lithium salt, but also to the diffusion coefficient of its ions. As discovered in Figure 7, the radius of the solvent molecules greatly influences the ionic diffusion coefficient and the degree of dissociation of lithium salts. The ionic conductivity of the electrolyte is augmented by the increase in dissociated ions in it, so the ionic conductivity should correlate indirectly to the molecular radius of the solvent.
Figure 8 shows the correlation between the radii of solvent molecules and their ionic conductivity. The radii of the solvent molecules were estimated from the simulated total volume of the system under adequate pressure. Those ionic conductivities were obtained via the electric current occurring in non-equilibrium MD simulations, as explained in Section 2.2, so they are fully computational. The authors found that corresponding experimental results (at room temperature) were somewhat smaller (e.g., for EC, the experimental value was 8.3), but the dependency on the radii of solvent molecules was similar for the computational and experimental results [18,47]. It was found that the ionic conductivity becomes higher as the molecular radius of the solvent decreases. From the Nernst–Einstein relation expressed by Equation (1), the ionic conductivity can be assumed to be exactly proportional to the diffusion coefficient of ions. Additionally, then, from the Stokes–Einstein relation expressed by Equation (4), the diffusion coefficient is inversely proportional to the diffusion radius of the solvent molecule. Thus, from these results, a solvent molecule as small as possible is preferable to improve the ionic conductivity of the electrolyte, and we expect the development of a much smaller molecule for a better solvent. In this context, we see later in Section 3.3 the possibility that, when a smaller molecule is used, the performance can be enhanced.
3.2. Mixed Solvents + 1M-LiPF6 Electrolyte Solutions
In addition to the electrolyte solutions using single solvents reported on in the previous section, we also calculated solution models comprising mixed solvents, as shown in Table 1b. We investigated the dependency of the mixture ratio on ionic conductivity and observed the atomic behavior of the solvation shell around Li+ ions.
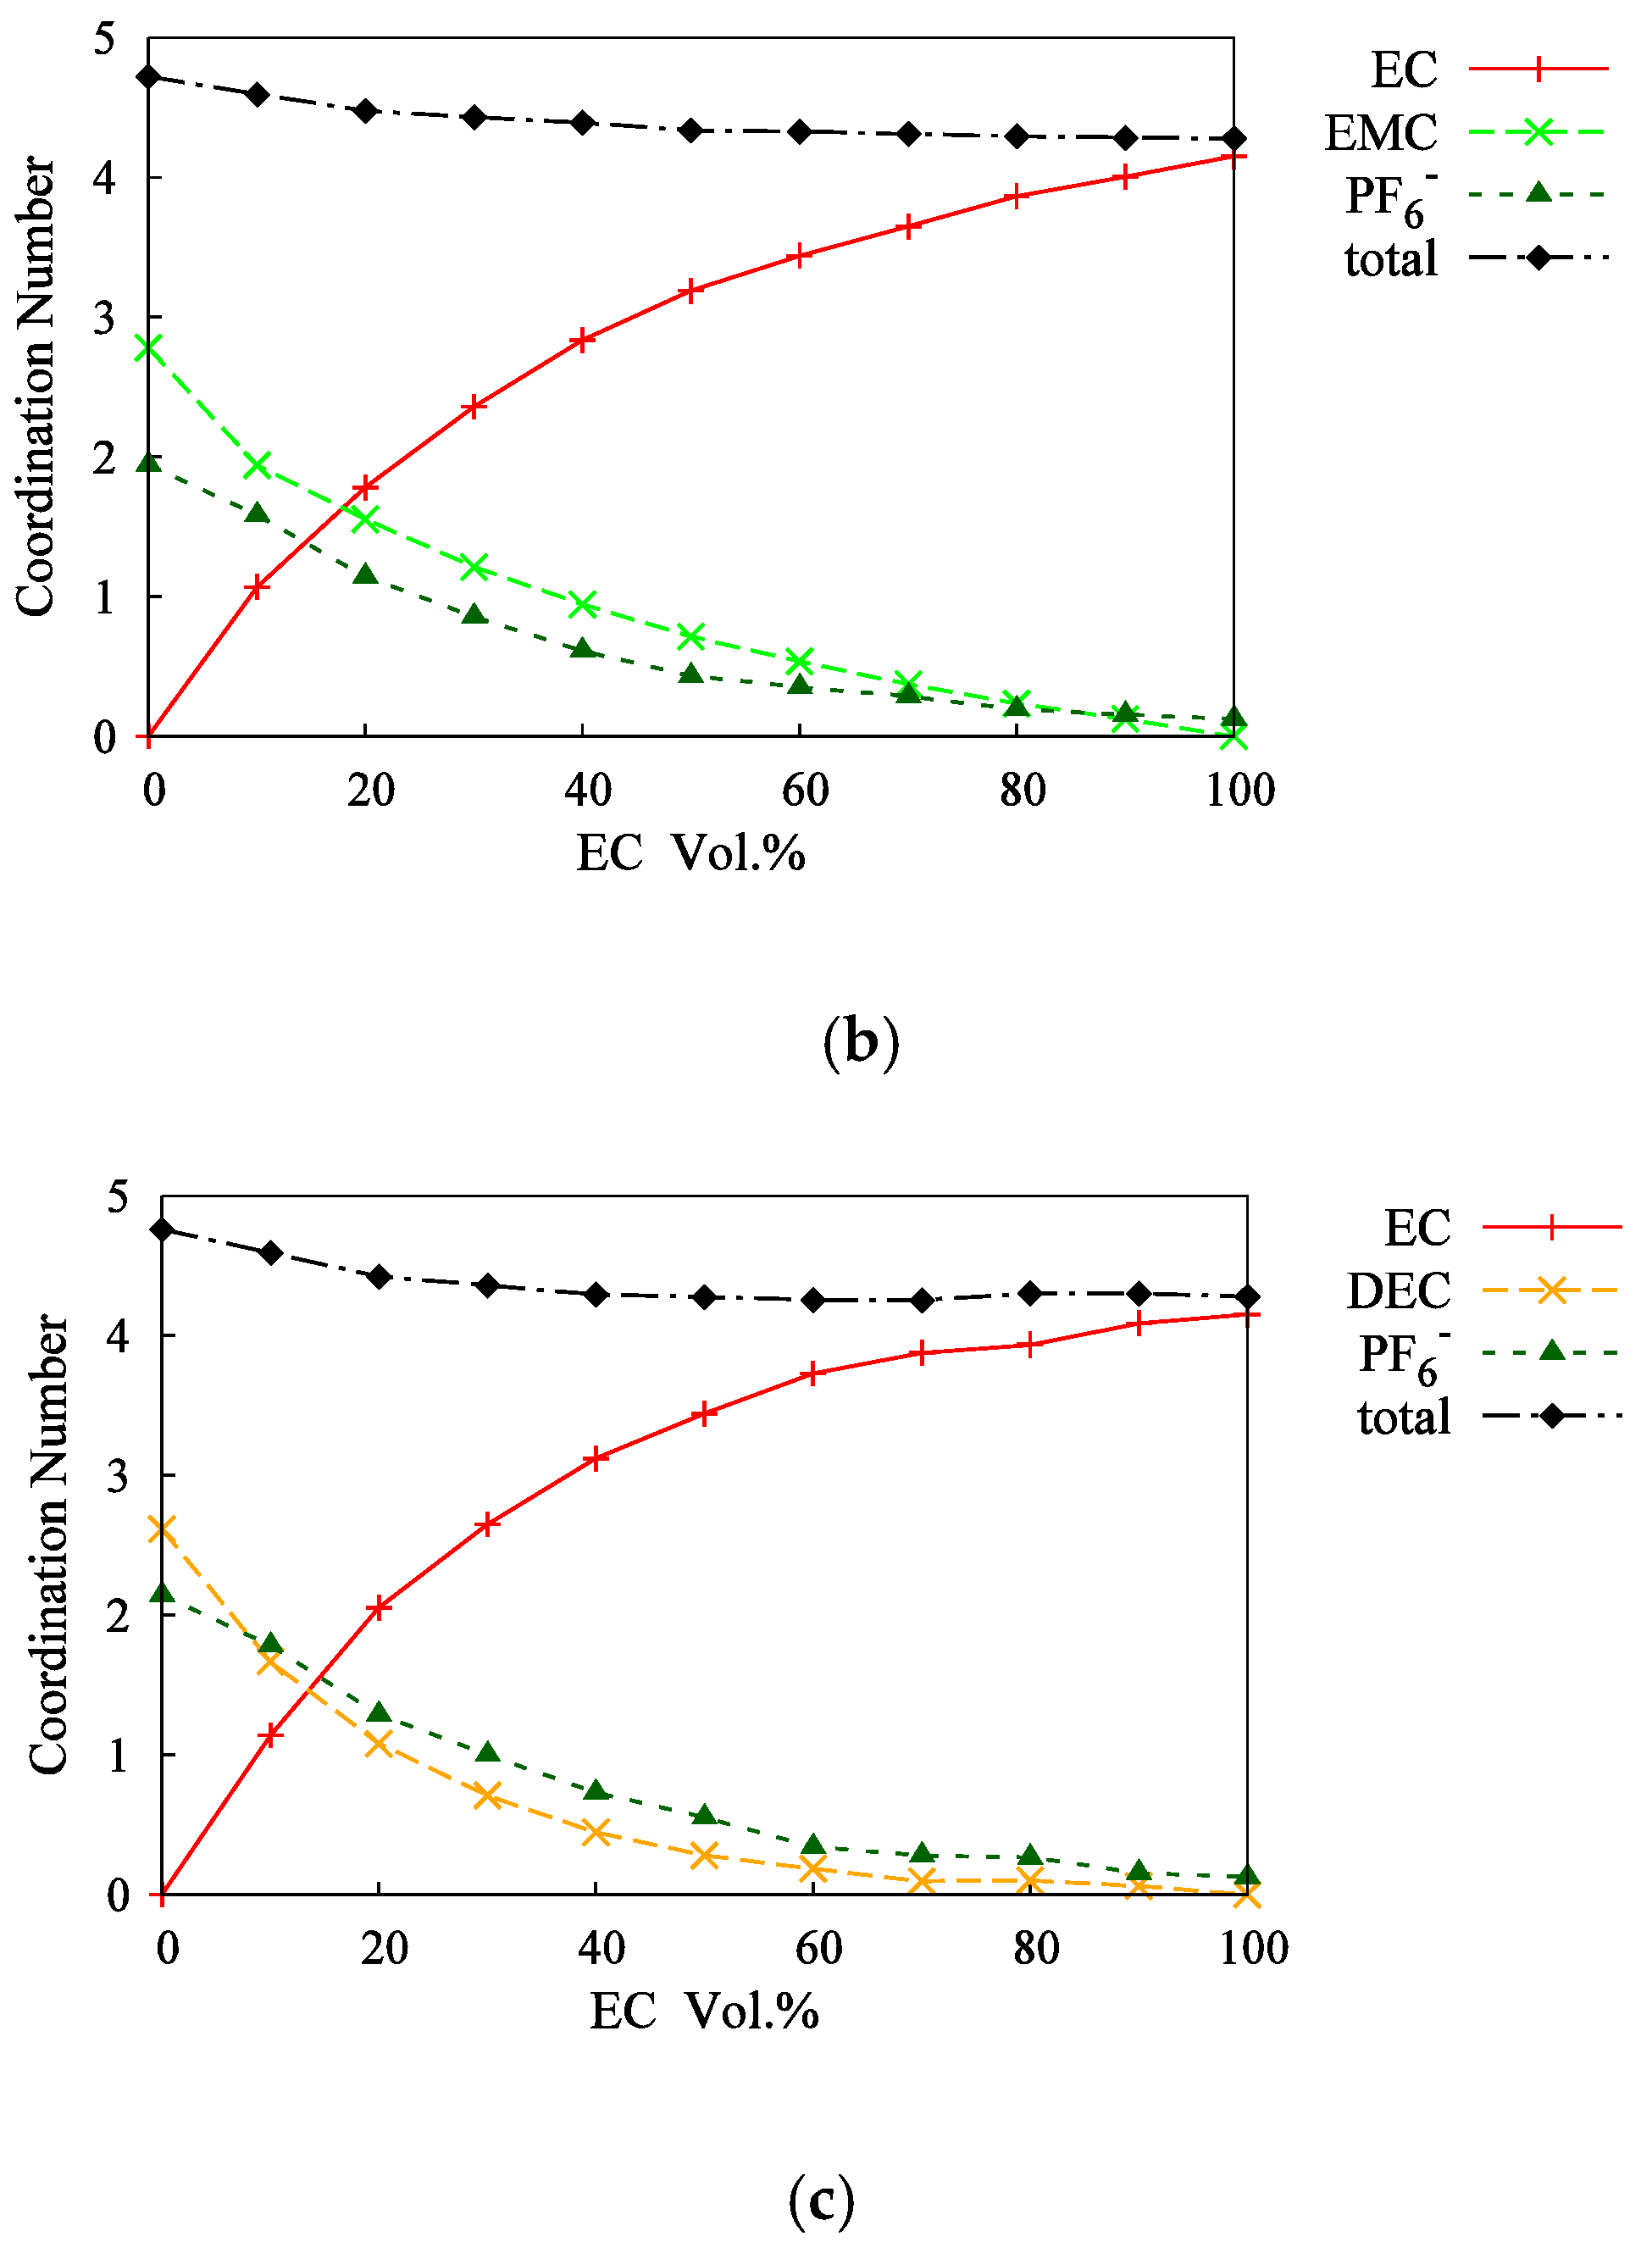
Figure 9 shows the ionic conductivities obtained for electrolyte solutions made of mixed solvents. The solid and dashed lines represent the results obtained by the MD simulations and experiments (conducted at room temperature and atmospheric pressure), respectively. For the mixed solvent of EC + EMC (blue lines), the simulation agrees very well with the experimental values. The agreement is confirmed for only one group of solvents at present, but we found that this qualitative agreement between experimental and molecular (nano-scale) simulation results confirms the reliability of the methodology of our simulations. According to a previous study [48], it is suggested that the best performance is achieved with some electrolytes when the volume ratio of ingredients is 50:50. Additionally, in the present study, such a tendency of a maximal value can be clearly observed for the electrolyte comprising the mixture of EC+DMC, as shown in Figure 9 (red line). It is understood that the ion conductivity exhibits the maximum value when the volume ratio of the two molecules, EC and DMC, is approximately one. This fact also means that ion conductivity has a local maximum strongly depending on the best mixing ratio between solvents [12]. Figure 10 shows the estimates of the coordination numbers of Li+ ions in mixed electrolytes, which were calculated by numerically integrating RDF graphs. It is interesting that the number of total coordinates around Li+ ions is always approximately four in any electrolytic solution. In the EC + DMC electrolyte type, the coordination number, i.e., the size of the solvation shell, expands in proportion to the composition of EC molecules in the electrolytic solution. This indicates there is a tendency to build the coordination around the Li+ ion, which primarily selects EC molecules. This situation is called “selective coordination”. On the other hand, in other combinations of electrolytes, such as EC+EMC or EC + DEC, the coordination shell does not increase in a linear relation. That is, in these cases, selective coordination is not configured. Generally, due to high permittivity, a solvent molecule such as EC in the HPS category is more selectively coordinated to Li+ than solvents in the LVS category. As the number of coordinates of an EC molecule increases, the coordination number of PF6− decreases (almost reaching zero in the extreme). In that situation, EC molecules that have coordinated to the Li+ ion promote the dissociation of lithium salts. At this point, we must confine our conclusion to the solvent models we treated here. However, it is possibly stated that, if we can preferentially (selectively) configure HPS molecules to Li+ ions—that is, if selective solvation is formed—the lithium salt can be sufficiently dissociated even when the volume ratio of HPS is substantially small. This concept in optimizing the configuration of solvents around Li+ ions is shown schematically in Figure 11.
3.3. Using Formamide for the Electrolyte Solution
As discussed above, it is expected that if HPS molecules can be selectively coordinated to Li+ ions, an electrolyte solution will have a high degree of dissociation and low viscosity at the same time. In addition, as we see in Section 3.1 and Figure 5, a solvent molecule with a small size can be easily organized to have compact coordination with a Li+ ion. Hence, thinking highly of the size of the solvent molecule in the electrolyte solution, we computed and analyzed one of the ideal candidates, formamide, which was not treated above. In particular, the ionic conductivity and solvation structure of formamide were evaluated. Formamide is a substance with a relatively small molecular size, and its dielectric constant is larger than that of a water molecule. Figure 12 shows the molecular structure of formamide compared with other solvent molecules investigated above (EC, GVL, and DEC, for example), and at a glance, it is well recognized that formamide is a very compact and somewhat spherical molecule. Recent studies have already focused on formamide itself and a similar structure as a solvent molecule or an additive in electrolytes of LIB [49,50]. However, as a drawback, this molecule is a protic solvent having an N–H bond, which is easily dissolved. However, the performance of the electrolyte solution is highly improved if formamide can be put to use, since very high ionic conductivity can be expected. As models of electrolyte solution using formamide molecules, we prepared a model with pure solvent and one with a combination of solvents: formamide + 1M-LiPF6 and 30 Vol.% formamide +70 Vol.% DMC + 1M-LiPF6 (which is named 3F + 7DMC).
Figure 13 shows the relation between ionic conductivity and molecular radius in the single-solvent type of electrolyte solution (in Figure 13, plots of most solvents except for F (formamide) is the same as that already shown in Figure 8, but the range of the horizontal axis has changed to recognize the very small size of formamide). By including formamide, ion conductivity twice as high as that of EC + 1M-LiPF6 solvent was obtained. Figure 14 shows the RDF of Li+ ion in the model, 3F + 7DMC. It is guessed that selective solvation formed, because very high condensation of formamide molecules is clearly observed at the first peak of the RDF graph. It may be concluded that a small HPS molecule such as formamide will certainly improve the ionic conductivity of the electrolyte by virtue of the mechanism of its selective coordination. The effect of cyclic behavior on the performance was not at all estimated here, but we think that better solvents can be designed and developed effectively, such as this example.
3.4. Discussion
As predicted by our knowledge of molecular chemistry, it was firmly confirmed by MD simulations that the physical properties of electrolyte solvents composed of a single type of molecule depend on the size of the molecule. Density, diffusion coefficient, and viscosity obtained by the simulations are equivalent to those obtained by experiments [44,45,46,47]. This fact means that the force field used in the present MD simulation and a classical theory including dynamics of molecular system are quite appropriate for modeling these types of solvents. Unfortunately, the interaction of solvent molecules with an electrode could not be looked into by the classical MD theory used here, and new methodology that can should be considered in the future work (to the authors’ knowledge, there have already been some advanced studies [51,52,53,54,55]). Diffusivity and viscosity were theoretically considered by using Stokes–Einstein (SE) relation, and it was exhibited that the theory can explain the molecular motion which was equivalently obtained by MD simulation. By both theory and simulations, it was also confirmed that the molecular radius is one of key factors to decide properties of the electrolyte solvent. The simulation approach used here seems to possess great possibility, and in the future the approach will play an important role for designing new electrolyte solvents, being justified by experimental facts.
For the mixed solvents, experimental data in literatures are limited, so the results by MD simulation should be scrutinized to obtain physical properties and detailed molecular behaviors. As in the literature [13,14,15,16,17,18,19,20,21,22], solvation structures around Li+ ion were reproduced for many mixtures of molecules by the present study. There was a limitation that the degree of dissociation of lithium salts had to be estimated by assuming some solvation structure in microscopic scale. On the other hand, the present study showed that the coordination number of each molecular kind can be directly obtained by numerical integration of RDF values, and its dependency on the composition of molecules clearly exists. Our computational examples mean that MD simulations can determine or visualize the detailed microscopic state of a solvation structure in both qualitative and quantitative manners.
Based on our discussion of the dependency of coordination number on molecular size, formamide (F) could be an effective component of solvent molecules, though it may be a computational example that does not work well in practice. There exist some experimental facts on the use of F and similar molecules as electrolyte solvents [49,50], and our MD simulations suggested that it is a favorable component. However, if using F and similar molecules in actual solvents, one must check many things, such as the interactions with the electrode and the performance during the process cycle. Therefore, the results obtained here should be recognized as one insight in using smaller molecules such as F for solvents. The point is that the methodology of molecular simulations has the ability to explore such new materials and to help to develop LIB electrolytes [27,28].
4. Conclusions
In this study, we built molecular dynamics (MD) models of the electrolytes which are to be used in lithium-ion batteries and evaluated their macroscopic physical and structural properties, such as the diffusion coefficient, degree of dissociation, solvation shell, and coordination number, although a limited number of solvents were treated, and practical properties which will be important in the process cycle and other processes were not dealt with. These MD simulations revealed, at the atomistic level, different behaviors between electrolyte solvents. We were also successful in obtaining correlations between properties and between solvent molecules.
It was found that the smaller the molecular size of the solvent, the higher the degree of dissociation tends to be. When the molecular size of the solvent is relatively large, it is hard for those molecules to neatly or compactly coordinate to a lithium ion. However, the smaller the solvent molecule is, the more easily it forms a coordinated structure with Li+, leading to enhanced dissociation of lithium salts.
From the theoretical Stokes–Einstein relation, the diffusion coefficient is inversely proportional to the diffusion radius of the solvent molecule. Usually, a Li+ ion in electrolyte solution forms a certain solvation shell surrounded by solvent molecules. It was conceived that the diffusion coefficients of ions are closely related to those of the solvent molecules. Thus, it was suggested and confirmed that the molecular radius of the solvent is indirectly correlated to the ionic diffusion coefficient.
In the analyses of mixed solvent types, the averaged coordination number of the Li+ ion was approximately four in any electrolytic solution. In the EC+DMC electrolyte model, the size of the solvation shell changed in proportion to the coordination number. This indicates that there is no selective coordination to Li+ ions. Unlike this result, in other cases of combinations of solvent molecules in electrolytes, EC + EMC and EC + DEC, many EC molecules were selectively coordinated with Li+. As the number of EC coordinated with the Li+ ion increases, the coordination number of PF6− decreases. This result reflects the fact that EC molecules close to the Li+ ion promote the dissociation of lithium salts. Thus, it is understood that if we can selectively coordinate HPS molecules with Li+ ions, lithium salt will be dissociated well, even when the volume ratio of HPS molecules is small.
We also assessed the performance of formamide (F) as a possible and small solvent molecule. In the electrolyte combining formamide and DMC (3F + 7DMC), it is guessed that selective solvation will be successfully formed. From a general perspective, very small HPS molecules such as formamide will effectively improve the ionic conductivity of the electrolyte. It is supposed that such an electrolyte will provide sufficient dissociation of lithium salt and low viscosity; therefore, high ionic diffusivity may be realized. Thus, small HPS molecules, e.g., formamide, are encouraged to be included in the electrolyte so as to effectively improve its ionic conductivity.
Author Contributions
Conceptualization, K.-i.S. and Y.T. (Yoshihiro Takai); methodology, K.-i.S., Y.T. (Yoshihiro Takai) and T.S.; software, K.-i.S. and Y.T. (Yoshihiro Takai); validation, K.-i.S. and Y.T. (Yoshihiro Takai); formal analysis, Y.T. (Yoshihiro Takai); investigation, Y.T. (Yoshihiro Takai) and K.-i.S.; resources, K.-i.S.; data curation, K.-i.S. and Y.T. (Yoshihiro Takai); writing—original draft preparation, K.-i.S. and Y.T. (Yoshihiro Takai); writing—review and editing, K.-i.S.; visualization, Y.T. (Yoshihiro Takai) and K.-i.S.; supervision, K.-i.S., T.S., M.T. and Y.T. (Yoshimasa Takahashi); project administration, K.-i.S.; funding acquisition, K.-i.S., T.S., M.T. and Y.T. (Yoshimasa Takahashi). All authors have read and agreed to the published version of the manuscript.
Funding
This research received no external funding.
Acknowledgments
This study was supported by Daikin Industries, Ltd., and by the Kansai University Grant-in-Aid for the progress of research in a graduate course, 2017 (April) to 2018 (March).
Conflicts of Interest
There are no conflict to declare.
References
- Girishkumar, G.; McCloskey, B.; Luntz, A.C.; Swanson, S.; Wilcke, W. Lithium–air battery: Promise and challenges. J. Phys. Chem. Lett. 2010, 1, 2193–2203. [Google Scholar] [CrossRef]
- Mikhaylik, Y.V.; Akridge, J.R. Polysulfide shuttle study in the Li/S battery system. J. Electrochem. Soc. 2004, 151, A1969. [Google Scholar] [CrossRef]
- Liu, Y.; Zhang, R.; Wang, J.; Wang, Y. Current and future lithium-ion battery manufacturing. iScience 2021, 24, 102332. [Google Scholar] [CrossRef] [PubMed]
- De Luna, Y.; Abdullah, M.; Dimassi, S.N.; Bensalah, N. All-solid lithium-sulfur batteries: Present situation and future progress. Ionics 2021, 27, 4937–4960. [Google Scholar] [CrossRef]
- Wang, J.; Yamada, Y.; Sodeyama, K.; Chiang, C.H.; Tateyama, Y.; Yamada, A. Superconcentrated electrolytes for a high-voltage lithium-ion battery. Nat. Commun. 2016, 7, 12032. [Google Scholar] [CrossRef]
- Peled, E. The electrochemical behavior of alkali and alkaline earth metals in nonaqueous battery systems—The solid electrolyte interphase model. J. Electrochem. Soc. 1979, 126, 2047–2051. [Google Scholar] [CrossRef]
- Aurbach, D. Review of selected electrode–solution interactions which determine the performance of Li and Li ion batteries. J. Power Sources 2000, 89, 206–218. [Google Scholar] [CrossRef]
- Yazami, R.; Reynier, Y.F. Mechanism of self-discharge in graphite–lithium anode. Electrochem. Acta 2002, 47, 1217–1223. [Google Scholar] [CrossRef]
- Broussely, M.; Herreyre, S.; Biensan, P.; Kasztejna, P.; Nechev, K.; Staniewicz, R.J. Aging mechanism in Li ion cells and calendar life predictions. J. Power Sources 2001, 97–98, 13–21. [Google Scholar] [CrossRef]
- Smart, M.C.; Ratnakumar, B.V.; Ryan-Mowrey, V.S.; Surampudi, S.; Prakash, G.K.S.; Hu, J.; Cheung, I. Improved performance of lithium-ion cells with the use of fluorinated carbonate-based electrolytes. J. Power Sources 2003, 119–121, 359–367. [Google Scholar] [CrossRef]
- McBrayer, J.D.; Apblett, C.A.; Harrison, K.L.; Fenton, K.R.; Minteer, S.D. Mechanical studies of the solid electrolyte interphase on anodes in lithium and lithium ion batteries. Nanotechnology 2021, 32, 502005. [Google Scholar] [CrossRef]
- Ding, M.S.; Xu, K.; Zhang, S.S.; Amine, K.; Henriksen, G.L.; Jow, T.R. Change of conductivity with salt content, solvent composition, and temperature for electrolytes of LiPF6 in ethylene carbonate-ethyl methyl carbonate. J. Electrochem. Soc. 2001, 148, A1196–A1204. [Google Scholar] [CrossRef]
- Shkerin, S.N.; Profatilova, I.A.; Roh, S. Effect of ethylene carbonate concentration on the conductivity of carbonate-based electrolytes with LiPF6 for Li-ion batteries. Ionics 2009, 15, 761–764. [Google Scholar] [CrossRef]
- Lia, Q.; Chenb, J.; Fanb, L.; Kong, X.; Lua, Y. Progress in electrolytes for rechargeable Li-based batteries and beyond. Green Energy Environ. 2016, 1, 18–42. [Google Scholar] [CrossRef] [Green Version]
- Niu, H.; Wang, L.; Guan, P.; Zhang, N.; Yan, C.; Ding, M.; Guo, X.; Huang, T.; Hu, X. Recent advances in application of ionic liquids in electrolyte of lithium ion batteries. J. Energy Storage 2021, 40, 102659. [Google Scholar] [CrossRef]
- Aihara, Y.; Sugimoto, K.; Price, W.S.; Hayamizu, K. Ionic conduction and self-diffusion near infinitesimal concentration in lithium salt-organic solvent electrolytes. J. Chem. Phys. 2000, 113, 1981–1991. [Google Scholar] [CrossRef]
- Saito, Y.; Morimura, W.; Kuratani, R.; Nishikawa, S. Factors controlling the ionic mobility of lithium electrolyte solutions in separator membranes. J. Phys. Chem. C 2016, 120, 3619–3624. [Google Scholar] [CrossRef]
- Hayamizu, K. Direct relations between ion diffusion constants and ionic conductivity for lithium electrolyte solutions. Electrochim. Acta 2017, 254, 101–111. [Google Scholar] [CrossRef]
- Barthel, J.; Buchner, R.; Wismeth, E. FTIR spectroscopy of ion solvation of LiClO4 and LiSCN in acetonitrile, benzonitrile, and propylene carbonate. J. Solut. Chem. 2000, 29, 937–954. [Google Scholar] [CrossRef]
- Fulfer, K.D.; Kuroda, D.G. A comparison of the solvation structure and dynamics of the lithium ion in linear organic carbonates with different alkyl chain lengths. Phys. Chem. Chem. Phys. 2017, 19, 25140–25150. [Google Scholar] [CrossRef]
- Cazzanelli, E.; Mustarelli, P.; Benevelli, F.; Appetecchi, G.B.; Croce, F. Raman and NMR Analysis of LiClO4 concentrated solutions in ethylene carbonate–propylene carbonate. Solid State Ion. 1996, 86–88, 379–384. [Google Scholar] [CrossRef]
- Yang, L.; Xiao, A.; Lucht, B.L. Investigation of solvation in lithium ion battery electrolytes by NMR spectroscopy. J. Mol. Liq. 2010, 154, 131–133. [Google Scholar] [CrossRef]
- Miyamoto, K.; Yamakawa, S.; Hyodo, S.; Asahi, R. Annual Meeting of Japan Society for Molecular Science 2010 Abstract. 2010, 2B20. Available online: http://molsci.center.ims.ac.jp/area/2010/bk2010/papers/2B20_w.pdf (accessed on 25 February 2022). (In Japanese).
- Ong, M.T.; Verners, O.; Draeger, E.W.; Duin, A.C.T.V.; Lordi, V.; Pask, J.E. Lithium ion solvation and diffusion in bulk organic electrolytes from first-principles and classical reactive molecular dynamics. J. Phys. Chem. B 2015, 119, 1535–1545. [Google Scholar] [CrossRef] [PubMed] [Green Version]
- Skarmoutsos, I.; Ponnuchamy, V.; Vetere, V.; Mossa, S. Li+ solvation in pure, binary, and ternary mixtures of organic carbonate electrolytes. J. Phys. Chem. C 2015, 119, 4502–4515. [Google Scholar] [CrossRef] [Green Version]
- Masia, M.; Probst, M.; Rey, R. Ethylene carbonate–Li+: A theoretical study of structural and vibrational properties in gas and liquid phases. J. Phys. Chem. B 2004, 108, 2016–2027. [Google Scholar] [CrossRef]
- Borodin, O.; Smith, G.D.; Fan, P. Molecular dynamics simulations of lithium alkyl carbonates. J. Phys. Chem. B 2006, 110, 22773–22779. [Google Scholar] [CrossRef]
- Borodin, O.; Smith, G.D. Quantum chemistry and molecular dynamics simulation study of dimethyl carbonate: Ethylene carbonate electrolytes doped with LiPF6. J. Phys. Chem. B 2009, 113, 1763–1776. [Google Scholar] [CrossRef]
- Starovoytov, O.N. Development of a polarizable force field for molecular dynamics simulations of lithium-ion battery electrolytes: Sulfone-based solvents and lithium salts. J. Phys. Chem. B 2021, 125, 11242–11255. [Google Scholar] [CrossRef]
- Lytle, T.K.; Muralidharan, A.; Yethiraj, A. Why lithium ions stick to some anions and not others. J. Phys. Chem. B 2021, 125, 4447–4455. [Google Scholar] [CrossRef]
- Karatrantosa, A.V.; Ohba, T.; Cai, Q. Diffusion of ions and solvent in propylene carbonate solutions for lithium-ion battery applications. J. Mol. Liq. 2020, 320, 114351. [Google Scholar] [CrossRef]
- Abraham, M.J.; Murtola, T.; Schulz, R.; Pall, S.; Smith, J.C.; Hess, B.; Lindahl, E. GROMACS: High performance molecular simulations through multi-level parallelism from laptops to supercomputers. SoftwareX 2015, 1–2, 19–25. [Google Scholar] [CrossRef] [Green Version]
- Case, D.A.; Cerutti, D.S.; Cheatham, T.E., III; Darden, T.A.; Duke, R.E.; Giese, T.J.; Gohlke, H.; Goetz, A.W.; Greene, D.; Homeyer, N.; et al. AMBER 2017 Reference Manual; University of California: San Francisco, CA, USA, 2017. [Google Scholar]
- Xu, K. Nonaqueous liquid electrolytes for lithium-based rechargeable batteries. Chem. Rev. 2004, 104, 4303–4417. [Google Scholar] [CrossRef] [PubMed]
- Martinez, L.; Andrade, R.; Birgin, E.G.; Martinez, J.M. Packing optimization for automated generation of complex system’s initial configurations for molecular dynamics and docking. J. Comput. Chem. 2003, 24, 819–825. [Google Scholar] [CrossRef] [PubMed]
- Nose, S. A unified formulation of the constant temperature molecular dynamics methods. J. Chem. Phys. 1984, 81, 511–519. [Google Scholar] [CrossRef] [Green Version]
- Hoover, W.G. Canonical dynamics: Equilibrium phase-space distributions. Phys. Rev. A 1985, 31, 1695–1697. [Google Scholar] [CrossRef] [Green Version]
- Parrinello, M.; Rahman, A. Crystal structure and pair potentials: A molecular-dynamics study. Phys. Rev. Lett. 1980, 45, 1196–1199. [Google Scholar] [CrossRef]
- Darden, T.; York, D.; Pedersen, L. Particle mesh Ewald: An N⋅log(N) method for Ewald sums in large systems. J. Chem. Phys. 1993, 98, 10089–10092. [Google Scholar] [CrossRef] [Green Version]
- Aksimentiev, A.; Schulten, K. Imaging α-hemolysin with molecular dynamics: Ionic conductance, osmotic permeability, and the electrostatic potential map. Biophys. J. 2005, 88, 3745–3761. [Google Scholar] [CrossRef] [Green Version]
- Calero, C.; Faraudo, J.; Aguilella-Arzo, M. Molecular dynamics simulations of concentrated aqueous electrolyte solutions. Mol. Simul. 2011, 37, 123–134. [Google Scholar] [CrossRef] [Green Version]
- Palmer, B.J. Transverse-current autocorrelation-function calculations of the shear viscosity for molecular liquids. Phys. Rev. E 1994, 49, 359–366. [Google Scholar] [CrossRef]
- Takai, Y.; Terai, Y.; Saitoh, K.; Takuma, M.; Takahashi, Y.; Sato, T. Molecular dynamics simulation of Li-ion coordination structure and transport properties in LIB electrolytes: Influence of molecular size. Sci. Tech. Rep. Kansai Univ. 2019, 61, 1–10. [Google Scholar]
- National Center for Biotechnology Information. PubChem Compound Database. Available online: https://pubchem.ncbi.nlm.nih.gov (accessed on 25 February 2022).
- Chemicalbook. Available online: https://www.chemicalbook.com/ (accessed on 13 March 2022).
- Hayamizu, K. Ion and Solvent Self-Diffusion Coefficients for Lithium Battery Electrolytes (Part 1): Organic Solution Electrolytes. JEOL Application Note. 2012, pp. 1–77. Available online: http://j-resonance.com/corporate/images/application/nmr/nm131015.pdf (accessed on 25 February 2022). (In Japanese).
- Hayamizu, K.; Aihara, Y.; Arai, S.; Martinez, C.G. Pulse-gradient spin-echo 1H, 7Li, and 19F NMR diffusion and ionic conductivity measurements of 14 organic electrolytes containing LiN(SO2CF3)2. J. Phys. Chem. B 1999, 103, 519–524. [Google Scholar] [CrossRef] [PubMed]
- Hayashi, K.; Nemoto, Y.; Tobishima, S.; Yamaki, J. Electrolyte composition dependence on lithium secondary cell performance. Key Eng. Mater. 1999, 157–158, 273–280. [Google Scholar] [CrossRef]
- Sekhar, B.C.; Hachicha, R.; Maffre, M.; Bodin, C.; Le Vot, S.; Favier, F.; Fontaine, O. Evaluation of the properties of an electrolyte based on formamide and LiTFSI for electrochemical capacitors. J. Electrochem. Soc. 2020, 167, 110508. [Google Scholar] [CrossRef]
- You, L.; Duan, K.; Zhang, G.; Song, W.; Yang, T.; Song, X.; Wang, S.; Liu, J. N,N-dimethylformamide electrolyte additive via a blocking strategy enables high-performance lithium-ion battery under high temperature. J. Phys. Chem. C 2019, 123, 5942–5950. [Google Scholar] [CrossRef]
- Leung, K.; Budzien, J.L. Ab initio molecular dynamics simulations of the initial stages of solid–electrolyte interphase formation on lithium ion battery graphitic anodes. Phys. Chem. Chem. Phys. 2010, 12, 6583–6586. [Google Scholar] [CrossRef] [Green Version]
- Lee, S.; Park, S.-S. Dielectric properties of organic solvents from non-polarizable molecular dynamics simulation with electronic continuum model and density functional theory. J. Phys. Chem. B 2011, 115, 12571–12576. [Google Scholar] [CrossRef]
- Leung, K.; Rempe, S.B.; Foster, M.E.; Ma, Y.; Martinez del la Hoz, J.M.; Sai, N.; Balbuena, P.B. Modeling electrochemical decomposition of fluoroethylene carbonate on silicon anode surfaces in lithium ion batteries. J. Electrochem. Soc. 2014, 161, A213–A221. [Google Scholar] [CrossRef]
- Takenaka, N.; Sakai, H.; Suzuki, Y.; Uppula, P.; Nagaoka, M. A computational chemical insight into microscopic additive effect on solid electrolyte interphase film formation in sodium-ion batteries: Suppression of unstable film growth by intact fluoroethylene carbonate. J. Phys. Chem. C. 2015, 119, 18046–18055. [Google Scholar] [CrossRef]
- Alzate-Vargas, L.; Blau, S.M.; Spotte-Smith, E.W.C.; Allu, S.; Persson, K.A.; Fattebert, J.-L. Insight into SEI growth in Li-ion batteries using molecular dynamics and accelerated chemical reactions. J. Phys. Chem. C 2021, 125, 18588–18596. [Google Scholar] [CrossRef]
Figure 1.
An example of a snapshot of molecules in a non-equilibrium MD simulation conducted with a constant electric field.
Figure 1.
An example of a snapshot of molecules in a non-equilibrium MD simulation conducted with a constant electric field.

Figure 2.
Correlations of physical properties between molecular simulations and experiments (dashed lines represent the equivalence between computations and experiments). (a) For density [44,45]; (b) for diffusion coefficient [46,47]; (c) for viscosity [46,47].

Figure 3.
Comparison of solvation shell. (a) EC + 1M-LiPF6; (b) DMC + 1M-LiPF6.

Figure 4.
Correlation between molecular radius and coordination number of Li+.

Figure 5.
Correlation between molecular radius and degree of dissociation.

Figure 6.
The curve of the Stokes–Einstein relation using the viscosity and the radius of the solvent molecule, which was calculated by MD simulations.
Figure 6.
The curve of the Stokes–Einstein relation using the viscosity and the radius of the solvent molecule, which was calculated by MD simulations.

Figure 7.
Relationship between and or .

Figure 8.
The correlation between the radii of solvent molecules and their ionic conductivity. The ionic conductivity is inversely proportional to the radius of the solvent, as approximated by the dashed curve.
Figure 8.
The correlation between the radii of solvent molecules and their ionic conductivity. The ionic conductivity is inversely proportional to the radius of the solvent, as approximated by the dashed curve.

Figure 9.
Ionic conductivity in mixed-electrolyte models.

Figure 10.
Estimation of the solvation shell about Li+ in mixed electrolytes. (a) EC + DMC + 1M-LiPF6; (b) EC + EMC + 1M-LiPF6; (c) EC + DEC + 1M-LiPF6.
Figure 10.
Estimation of the solvation shell about Li+ in mixed electrolytes. (a) EC + DMC + 1M-LiPF6; (b) EC + EMC + 1M-LiPF6; (c) EC + DEC + 1M-LiPF6.


Figure 11.
A schematic of a molecular configuration of the selective solvation (LVS means a solvent molecule with low viscosity, HPS means a solvent molecule with high permittivity).
Figure 11.
A schematic of a molecular configuration of the selective solvation (LVS means a solvent molecule with low viscosity, HPS means a solvent molecule with high permittivity).

Figure 12.
Molecular structure of formamide, the smallest one investigated here, compared with other larger molecules of solvents treated above. (a) Formamide (F); (b) ethylene carbonate (EC); (c) γ-valerolactone (GVL); (d) diethyl carbonate (DEC).
Figure 12.
Molecular structure of formamide, the smallest one investigated here, compared with other larger molecules of solvents treated above. (a) Formamide (F); (b) ethylene carbonate (EC); (c) γ-valerolactone (GVL); (d) diethyl carbonate (DEC).

Figure 13.
Comparison of the ionic conductivity of electrolytes against the radii of their solvents, including the result of formamide (except for F, plots are the same as in Figure 8).
Figure 13.
Comparison of the ionic conductivity of electrolytes against the radii of their solvents, including the result of formamide (except for F, plots are the same as in Figure 8).

Figure 14.
RDF around Li+ in the model of 3F + 7DMC + 1M-LiPF6 (which is the model named 3F + 7DMC).
Figure 14.
RDF around Li+ in the model of 3F + 7DMC + 1M-LiPF6 (which is the model named 3F + 7DMC).


Table 1.
Details of the molecular compositions for the electrolyte model. (a) Single solvent of electrolyte solution. (b) Mixed solvents of electrolyte solution.
Table 1.
Details of the molecular compositions for the electrolyte model. (a) Single solvent of electrolyte solution. (b) Mixed solvents of electrolyte solution.
| (a) | ||||
|---|---|---|---|---|
| Molecule | The Number of Molecules | |||
| EC | 7184 | |||
| FEC | 6664 | |||
| PC | 5572 | |||
| BC | 4639 | |||
| GBL | 6191 | |||
| GVL | 4951 | |||
| DMC | 5607 | |||
| EMC | 4580 | |||
| DEC | 3896 | |||
| (b) | ||||
| Model * | The Number of Molecules | |||
| HPS | LVS | |||
| EC | DMC | EMC | DEC | |
| 1EC9LVS | 718 | 5047 | 4122 | 3507 |
| 2EC8LVS | 1437 | 4486 | 3664 | 3117 |
| 3EC7LVS | 2155 | 3925 | 3206 | 2727 |
| 4EC6LVS | 2873 | 3365 | 2748 | 2338 |
| 5EC5LVS | 3592 | 2804 | 2290 | 1948 |
| 6EC4LVS | 4310 | 2243 | 1832 | 1559 |
| 7EC3LVS | 5028 | 1682 | 1374 | 1169 |
| 8EC2LVS | 5747 | 1121 | 916 | 799 |
| 9EC1LVS | 6465 | 561 | 458 | 390 |
* In the label of each model, a single digit preceding a molecular type represents the mixing volume ratio per 10%. For example, 3EC7LVS means that volume ratio of EC is 30%, and for LVS molecules (DMC, EMC, or DEC) it is 70%.
Publisher’s Note: MDPI stays neutral with regard to jurisdictional claims in published maps and institutional affiliations. |
© 2022 by the authors. Licensee MDPI, Basel, Switzerland. This article is an open access article distributed under the terms and conditions of the Creative Commons Attribution (CC BY) license (https://creativecommons.org/licenses/by/4.0/).
Share and Cite
MDPI and ACS Style
Saitoh, K.-i.; Takai, Y.; Sato, T.; Takuma, M.; Takahashi, Y. Optimization of LIB Electrolyte and Exploration of Novel Compounds via the Molecular Dynamics Method. Batteries 2022, 8, 27. https://doi.org/10.3390/batteries8030027
AMA Style
Saitoh K-i, Takai Y, Sato T, Takuma M, Takahashi Y. Optimization of LIB Electrolyte and Exploration of Novel Compounds via the Molecular Dynamics Method. Batteries. 2022; 8(3):27. https://doi.org/10.3390/batteries8030027
Chicago/Turabian StyleSaitoh, Ken-ichi, Yoshihiro Takai, Tomohiro Sato, Masanori Takuma, and Yoshimasa Takahashi. 2022. "Optimization of LIB Electrolyte and Exploration of Novel Compounds via the Molecular Dynamics Method" Batteries 8, no. 3: 27. https://doi.org/10.3390/batteries8030027
Note that from the first issue of 2016, this journal uses article numbers instead of page numbers. See further details here.